
Gold Price Predictions Analysis April 2017
Share
XAUUSD Gold Price Predictions Today
XAUUSD Gold Price Forecast 26th April 2017 ( Update )
The more bearish movement was expected in yesterday analysis, Gold moves exactly according to the expectations and hit the second target 1263.
Gold is forming a descending channel on an hourly chart, and moving in high low and lower low direction. The next possible resistance of rising channel is at 1275-76. Gold is at its support level and it could bounce from 1259-61 towards next resistance level around 1275-76.Gold may give the bearish move with a new low around 1247-51.
Please have a look at 1-hour chart below, I have mentioned possible next movement diagram with a target area.
1-Hour Gold Price Chart

Gold Price Predictions 2017 26th April 1h Chart
Gold Support & Resistance Levels April 25th, 2017
Resistance 1: 1273-75
Support 1: 1261
Support 2: 1247-51
Wish you good luck and happy trading
XAUUSD Gold Price Forecast 25th April 2017
The bearish movement was expected in the previous analysis, Gold moves exactly according to the expectation and met our first target 1271, The second target was 1263 which was not met in yesterday movement.
Gold is still in a bearish correction mode and it can move lower towards 1263 and 1255 level in extension, We may look for bullish movement signal if gold fail to break the support of 1255-57 level.
I am sharing 3 different time frame chart analysis below to deliver my logical thought for the gold price.
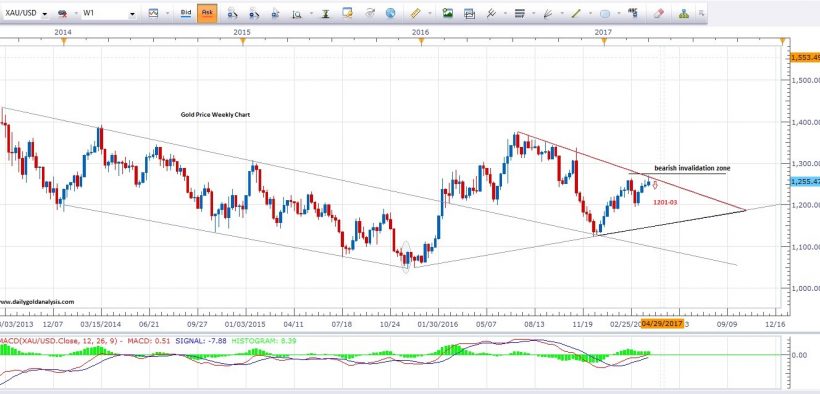
XAUUSD Gold Price Predictions Weekly
Gold fail to break the trend resistance in a weekly time frame.Bearish movement from the resistance level confirms the correction which was pending from last few weeks.Current market price is 1269-70 level, Gold possible minimum next weekly target could be 1255-57 level.If gold move and close below 1255 in a weekly time frame chart, it will be the indication for a more bearish move for a couple of next weeks towards 1229-31 level.The bearish target may only confirm if gold closes below 1255 in a weekly time frame chart.
Weekly Gold Price Chart

Gold Price Predictions 2017 Weekly Chart 25th April
XAUUSD Gold Price Predictions Daily
The reversal from the resistance line in a daily chart confirm the bearish move which was expected.Gold move lower yesterday and made a low around 1265 area.Our second target was 1263 which was not hit.I believe gold may hit its second target 1263 today and it could move lower towards 1255-57 level.
1255-57 area is the next support zone.Phycological gold could find a small range bound from the support level 1255-57.Break of support may take gold towards new low around 1231.If gold fail to break the support, then most probably we may see a new bullish rally towards next high above 1300 level.I will update the analysis, once I get proper bullish signal.
Please have a look at the daily gold chart below.
Daily Gold Price Chart

Gold Price Predictions 2017 Daily Chart 25th April.jpg
XAUUSD Gold Price Predictions Hourly
The 4-hour chart gives the earliest signal if we place the chart patterns carefully. Gold is moving as per the expected analysis from our previous 4-hour chart. Current Gold Price is 1270 and there is still enough selling momentum in the hourly chart to take gold towards our second target 1263.
I have mentioned the support line in the 4-hour chart below, resistance, this area could be the watching area for next gold move.Break of support could take gold towards 1231 level. Bounce from the support may give another touch to a resistance, and this time resistance will be around 128-81 zone.
Please have a look at 4-hour chart below, i have mentioned possible next movement diagram with target areas.
4-Hour Gold Price Chart

Gold Price Predictions 2017 4h Chart 25th April
Gold Support & Resistance Levels April 25th, 2017
Resistance 1: 1279-80
Support 1: 1263
Support 2: 1257
Wish you good luck and happy trading
XAUUSD Gold Price Forecast 20th April 2017 ( Update )
Yesterday we expected bearish movement with minimum target 1271.Market move lower and bounce from 1274 zone.Current gold price is 1279, It seems bearish bias is still not over and we are still expecting a more bearish move towards minimum 1271 and maximum 1263.
Please have a look at 4-hour time frame chart below, I have drawn possible next movement diagram with target and invalidation area.
4-Hour Gold Price Chart
Gold Support & Resistance Levels April 20th, 2017
Resistance 1: 1287-88
Support 1: 1271
Support 2: 1263
Wish you good luck and happy trading
XAUUSD Gold Price Forecast 19th April 2017
We expected a correction from major weekly resistance level 1271 towards minimum 1245.It did not happen and gold couldn’t make reversal from resistance zone and break above the weekly resistance line which was not expected.Current gold price is around 1288-89 and XAUUSD made high exact at 1293 level.We still believe gold may not give more upward movement from this level.I am expecting a strong selling this week and gold may remain in bearish mode for a couple of next days.I am sharing three different timeframe chart analysis below to share my logical technical analysis regarding the upcoming gold move.
XAUUSD Gold Price Predictions Weekly
The gold fails to reverse from major resistance level 1267-71 which were our watching zone.Movement and closing above 1271 invalidate our correction thoughts and took gold towards next high at 1293.I believe gold has completed its bullish cycle and ready to start its bearish move towards next bearish pattern.The resistance becomes support after the break and gold may get its first support zone around 1271 level which could be our watching area to check the volume for the more bearish move.If gold break 1271 in the weekly time frame and close below the support then most probably gold may give more bearish move towards 1245 and 1227 in the case of extension.The yellow metal is also forming a possible long-term symmetric triangle formation. I have already mentioned the symmetric pattern in the chart below but this pattern will confirm if gold follow and resistance its support and resistance levels.I will share the pattern update once it is confirmed.Please have a look at the weekly chart below to get the overview.
Weekly Gold Price Chart

Gold Price Predictions 2017 Weekly Chart 19th April
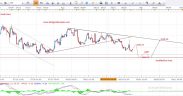
XAUUSD Gold Price Predictions Daily
After breaking the major resistance zone in a daily time frame chart, Gold move towards its next resistance level which was around 1293.It is expecting XAUUSD may not move higher and it’s a time to start a bearish movement.The gold minimum bearish target may b the first support area which was previous resistance 1271 and 1263 level.We will decide to remain in bearish mode if gold break 1263 zone in a weekly and daily time frame chart.Please have a look at the daily gold chart below, I have mentioned next support zone and invalidation point.
Daily Gold Price Chart

Gold Price Predictions 2017 Daily Chart 19th April
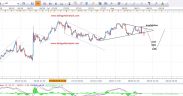
XAUUSD Gold Price Predictions Hourly
We love to share hourly gold price forecast because it gives us earliest signal of a trend reversal to catch the major move.Gold is forming a couple of reversal candle patterns in 4H time frame chart which is the earliest indication of upcoming bearish move expectations.Rejection from the falling resistance line twice is giving selling signal.Minimum 4H support is at 1278 level. The movement below 1278 will give more confidence and it will also confirm our weekly and daily thoughts that we discussed in the above-written analysis.
4H Gold Price Chart

Gold Price Prediction 2017 4H Chart 19th April
Please keep in mind if gold move higher and break above the resistance line which I draw in the 4H chart above ( Red Line ), It way be the earliest signal of invalidation as well.
Gold Support & Resistance Levels April 19th 2017
Resistance 1: 1293
Support 1: 1278
Support 2: 1271
Support 3: 1263
Wish you good luck and happy trading
XAUUSD Gold Price Forecast 11th April 2017

Gold Price Predictions 2017 4H Chart
Gold Support & Resistance Levels April 11th 2017
Resistance 1: 1273-74
Support 1: 1257-58
Wish you good luck and happy trading
XAUUSD Gold Price Forecast 10th April 2017
The yellow metal was trading near to its resistance zone and it was expected a bearish move from the resistance level 1267-71.Gold move exactly according to the expectations and gave a bearish signal from the resistance zone.Daily closing as a shooting star is also in a favor of daily correction for a bearish short-term move.I am sharing gold trade idea with my logical technical thoughts below.
XAUUSD Gold Price Predictions Weekly
Gold is still trading near to its resistance zone and rejection from the major resistance 1267-71 gives us bearish thoughts for short term basis.Longer term gold trend is still bullish but we are expecting a correction before a new peak zone.The next support for the minimum correction on the weekly time frame is around 1235-37 area and it can also extend towards weekly major support zone around 1201-03.
Alternately: If gold move higher without correction and close above 1271 in a weekly candle, this will be the earliest signal for bullish trend contusion and may take gold towards next peak level around 1307-09.
Please have a look at the weekly time frame gold chart below, I have mentioned possible next movement direction with invalidation area.
Weekly Gold Price Chart

Gold Price Predictions 2017 Weekly Chart
XAUUSD Gold Price Predictions Daily
A Beautiful shooting start candle closing in a daily time frame chart and rejection from major resistance 1267-71 gives us confidence towards our short-term bearish thoughts in gold.Gold could touch its falling resistance area again before a new bearish move. The new resistance level is forming at 1263-65 area which will be the best area for sellers.The yellow metal minimum correction target is 1235-37 which is also rising support in a daily chart mentioned below.
Alternately: If gold move higher, breaks and close above the falling resistance 1271 area mentioned in the chart below, this will invalidate our short term bearish thoughts and could take gold towards next bullish zone around 1307-09.
Daily Gold Price Chart

Gold Price Predictions 2017 Daily Chart
Gold Support & Resistance Levels April 10th 2017
Resistance 1: 1263-65
Resistance 2: 1271
Support 1: 1245-46
Support 2: 1235
Wish you good luck and happy trading
Join Our Telegram Channel For More Updates
https://telegram.me/dailygoldanalysis
Note: Never risk more than 2% of your account capital in single trade.Always trade with the proper risk management plan.
Feel free to comment below if you have any concern regarding charts and analysis.Your feedback is always welcome and helps us to improve.
Wish you good luck and happy trading
Mati Ur Rehman
Gold Analyst @ Dailygoldanalysis.com


