
Gold Price Technical Forecast Update June 2017
Share

Gold Technical Forecast For June 2017
In our last gold technical forecast, it was expected the gold may touch 1249-51 level before a new bounce.This is what happened with yellow metal and it hit our targeted level in last week.
We have a couple of thoughts for next gold predictions.
I am sharing three different time frame Forex charts below to predict next possible gold movement.
Weekly Gold Technical Forecast
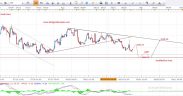
Gold is in a Bearish Trend from a couple of weeks and hit our expected bearish level last week around 1249-51.If we look at the gold price chart, we can see there is enough volume which can take gold towards more lower for minimum 1219-21 and maximum 1185-87 in a longer term.But we will look for the confirmation of more bearish move from the daily and hourly charts.
Please keep in mind we use weekly chart just to see the overview and set up the long term targets.
The falling resistance draws a red line at the weekly chart below is the watching area.If gold break and close above the resistance line in a weekly chart, it will invalidate our longer term bearish thoughts and could take gold towards new peak around 1345 minimum. We will discuss the bullish target if gold break the resistance mentioned below.
Weekly Gold Technical Forecast Chart

Gold-Price-Forecast-Weekly-Chart-Update
Daily Gold Technical Forecast
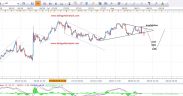
The gold is at it support level in a daily time frame.Bounce is expecting from the support level towards minimum 1263 and 1275 in the case of extension.As per the bearish volume increasing in a weekly chart, we will remain bearish but we will look for further confirmation.
If gold breaks its recent low and closes below 1239 in a daily chart, this will be the indication of a more bearish move towards 1229 & the movement below 1229 will give more confidence towards our longer term target 1219 and 1183-85 levels.
We will look for the bearish entry from the resistance level which is at 1263 and 1275 area or after the break of support at 1239.
Alternately if gold break and close above the daily resistance line which is mentioned in the chart below, this will be the indication of bearish invalidation and we will look for more confirmation in the weekly chart to change our thoughts from bearish to bullish move.
Daily Gold Technical Forecast Chart

Gold-Price-Forecast-Daily-Chart-Update
4-Hour Gold Technical Forecast
The 4-hour Technical chart is Love !!! 🙂
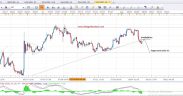
We use to analyze 4-hour chart to get the earliest signal for the next predictions. Gold is moving in descending channel in 4-hour chart and forming lower high and lower low.The current gold price is 1243-45 level and its a lower low area of descending channel.I am expecting a bounce from this level towards the next lower high zone which is at 1260-61 area as per the descending channel lines.If gold reverse from the resistance area then most probably it will touch the next lower low zone minimum 1231 and maximum 1219.
Please have a look at 4-hour chart, I have mentioned possible next movement diagram and invalidation zone as well.
4-Hour Gold Technical Forecast Chart

Gold-Price-Forecast-4H-Chart-Update
Gold Support & Resistance Levels
Resistance 1: 1261-63
Resistance 2: 1273-75
Support 1: 1239
Support 2: 1231
Support 3 : 1219
Wish you good luck and happy trading
Join Our Telegram Channel For More Updates
Gold Analysis Telegram Channel
Note: Never risk more than 2% of your account capital in single trade.Always trade with the proper risk management plan.
Feel free to comment below if you have any concern regarding charts and analysis.Your feedback is always welcome and helps us to improve.
Wish you good luck and happy trading with Gold Technical Analysis
Mati Ur Rehman
Gold Analyst @ Dailygoldanalysis.com


Thanks alot