
Gold Forecast Today June 2017
Share
Gold Price Forecast June 2017
In our last analysis, we predicted the upward movement for minimum target 1277, this is what happened in gold and it moves exactly according to the expected levels. The Current gold trading price is 1277-78 and recent high was around 1295-96.
I believe gold could move lower towards its support level before a new bounce.
Today I am sharing three different time frame Gold Chart analysis for next gold price predictions.
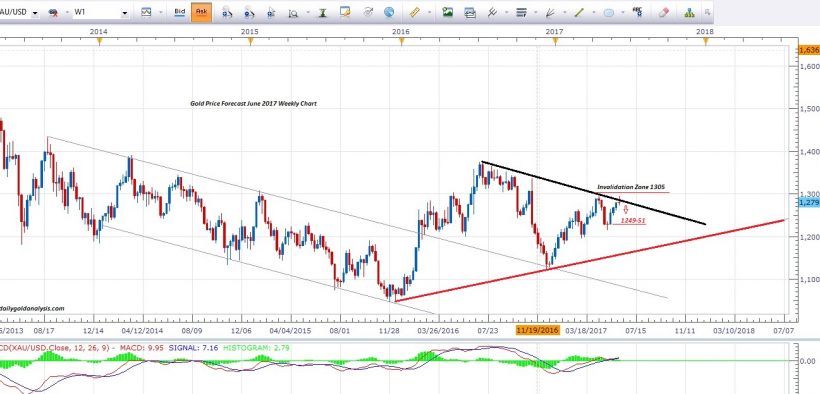
Weekly Gold Price Forecast 9th June 2017
The gold is at its resistance zone in a weekly time frame chart and moving at its trend line area at current market price.MACD is also indicating decreasing bull volume.( We are not the big fan of indicators but we use sometimes to support our View / Decision.
Gold next minimum support is forming at 1269 and 1249-51 in the case of extension.We will look for further movement confirmation at 1249 zone which is gold daily and weekly support level.
Alternately if yellow metal moves higher and closes above the weekly trend line and previous resistance, Then this will be the indication of changing the thoughts from bearish to bullish move for next possible target 1345.We will only take bullish move if gold close above 1305-06 in a weekly time frame chart.
Please have a look at the weekly gold price chart below.
Weekly Gold Price Forecast Chart

Gold-Price-Forecast-Weekly-Chart-June-2017
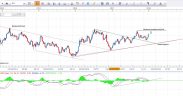
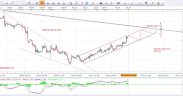
Daily Gold Price Forecast 9th June 2017
Gold is moving in a rising channel direction if we look at the daily chart.The next rising channel resistance is forming around 1345 and 1393 in a longer term direction.
At the other end, gold is trading near to its trend resistance level which cannot be ignored.A couple of reversal candle from resistance is indicating a bearish move towards rising channel support level which is at 1249-51 area.We will look for the bounce or bullish rally from the support level of rising channel showing in the chart below.
Alternately if gold fail to move lower and break / Close the trend resistance in a daily and weekly chart, this will be the earliest indication of bearish rejection and may take gold towards next high at 1345 level.The confirmation of bullish move could be around 1305-06 area.We personally look for a bullish move from the support zone to get the maximum benefit from the upcoming bullish move.1249-51 is the key level.
Please have a look at the daily gold chart below, I have mentioned the possible next movement diagram with an alternative confirmation zone.
Daily Gold Price Forecast Chart

Gold-Price-Forecast-Daily-Chart-June-2017
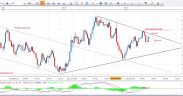
4-Hour Gold Price Forecast 9th June 2017
we will look 4-hour chart to get the earliest signal for an upcoming move.The gold rejects from the resistance level in 4-hour chart, We can also see the double top pattern formation in a chart below which itself a bearish signal.The minimum support according to the hourly chart is at 1269-70 area.
The break of support will give confidence for the target 1249-51.
The movement above the double top resistance level could lead gold towards next possible high around 1305-06 which is also the watching and confirmation area for next bullish movement.
Please have a look at 4-hour chart below, I have mentioned possible next movement diagram with confirmation areas.
4-Hour Gold Price Forecast Chart

Gold-Price-Forecast-4-Hour-Chart-June-2017
Gold Support & Resistance Levels
Resistance 1: 1295-96
Resistance 2: 1305-07
Support 1: 1269-71
Support 2: 1249-51
Wish you good luck and happy trading
Join Our Telegram Channel For More Updates
Gold Analysis Telegram Channel
Note: Never risk more than 2% of your account capital in single trade.Always trade with the proper risk management plan.
Feel free to comment below if you have any concern regarding charts and analysis.Your feedback is always welcome and helps us to improve.
Wish you good luck and happy trading with Gold Technical Analysis
Mati Ur Rehman
Gold Analyst @ Dailygoldanalysis.com


thanks sir for up date