
Daily Gold Analysis 31st March 2016
Share
Good Morning Metal Lovers
Yesterday Analysis we predict some downward movement and correction in metal.Gold move down to its first support level at 1221-23 . This is first support zone and possible buying area.If gold break the support then we may see gold at 1201-03 level.I am sharing 3 different time frame chart analysis to give logical view for possible next move.Please consider reading analysis below.
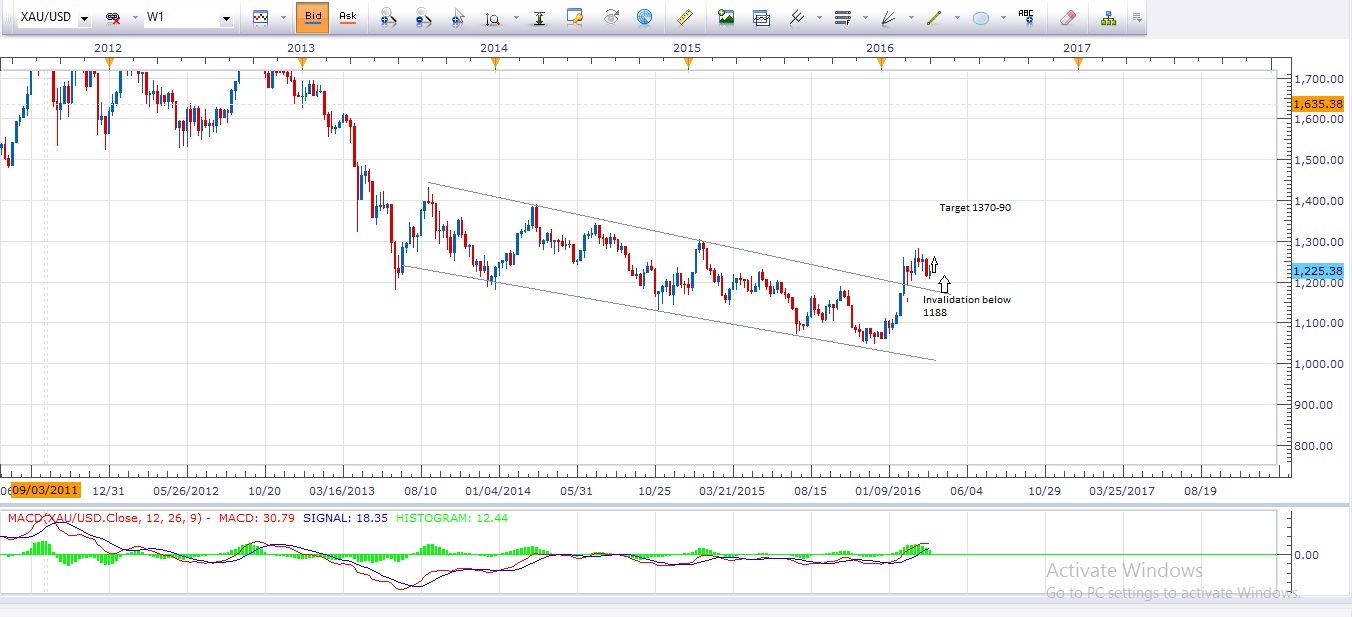
Weekly Chart Analysis
As per our previous analysis we are bullish in gold because gold recently break its longer term bearish channel that was forming in weekly chart.As per the law when resistance break it may behave as a support.Gold longer term and main support is at 1191-93 level and weekly target may 1370-90.We will look for buy entry from every low to get better price to jump in the market.Weekly overlook is totally in favor of buying gold as long as gold is moving above the main support level.Break and closing in weekly time frame chart below the support will invalidate our bullish thoughts and we may consider it was a false break.I have mention support and the target area in a chart below.
Weekly Chart
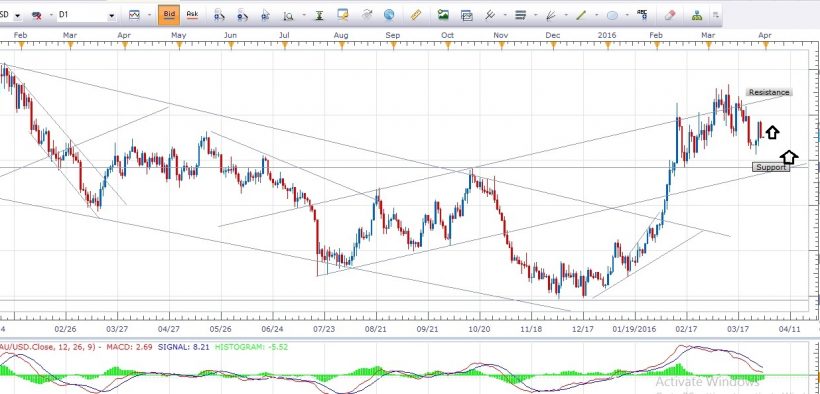
Daily Chart Analysis
Today closing in daily time frame chart is bearish but close above the first support still give possible buying thoughts.Gold may bounce from 1221-23 towards its first target that is around 1237-41 level.Movement and closing above this level will give more confirmation to remain in bullish bias.Gold next support is at 1201-03 level.If gold move down then the next possible buying entry will 1201-03.Gold main trend support is 1191-93.Movement and closing below this level will invalidate our bullish thoughts.I have spoted support and resistance zone in the chart below.
Daily Chart

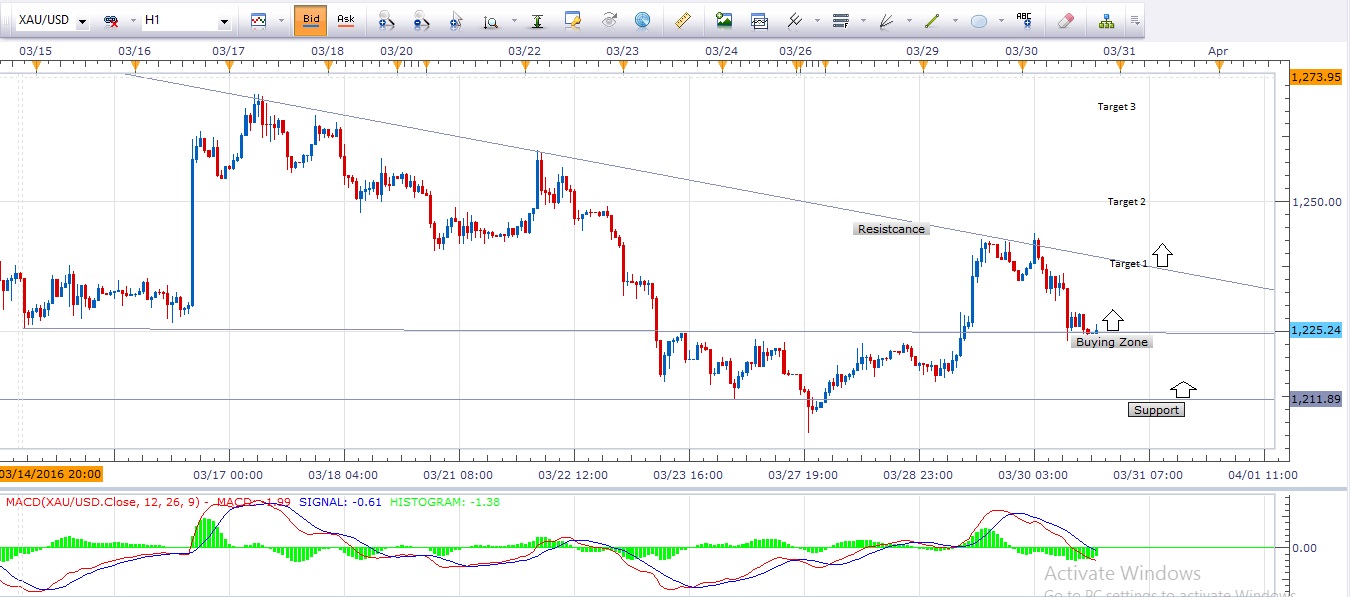
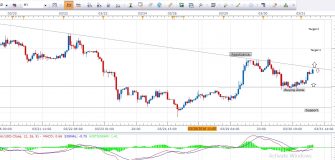
1 Hour Chart Analysis
I always like and prefer 1 hour time frame chart to get close picture and early prediction to get better entry point.Current market price is 1223-25 and it may b the bounce area for gold.Next support in 1 hour time frame chart is at 1211-13.Current market price may b the bounce area.If gold break this support then the possible next entry point in 1 hour time frame will be 1211-13 area.I suggest you to wait for the best price to jump in the rally.Gold next possible target may 1237-41.If break and close above 1241 we will add more buying entry with target 1249 and 1271-73 in extension.Please keep in mind gold main support is at 1191-93.
1 Hour Chart
Note : I suggest you to buy from the lower price to get better points or watch the resistance break in 1 hour chart to get entry confirmation.
Never risk more then 2% of your trade account in single trade.Adjust your stoploss and lot sizez according to money management plan.
Trade Recommendations : Those who want our trade recommendations with proper entry and target points may contact us via email.We have set our minimum fees for the paid clients.
Forex Education : Those who want to learn forex technical analysis can contact us via email.We will start our skype classes session for interested members.
Email : admin@dailygoldanalysis.com
Skype : mati_ji
We always welcome the feedback and comments regarding charts and analysis.
Wish you best of luck for trading
Mati Ur Rehman
Gold Analyst @ dailygoldanalysis.com


