
Daily Gold Analysis
Share

Good Afternoon Gold Lovers
Today i am starting my blog and submitting my first post about gold.Before starting the blog we will have to note something very important.This blog is only for educational purpose.We will discuss about gold analysis and predict the market through technical analysis.All analysis will based on technical and there is no guarantee and trade recommendations for those who dont know the basics of risk management and money management in forex market.We will discuss about money management and risk management in different section.
So here we are starting.I am posting Weekly, daily and 4 hour time frame analysis to get the idea for next move in gold.
Weekly Gold Analysis
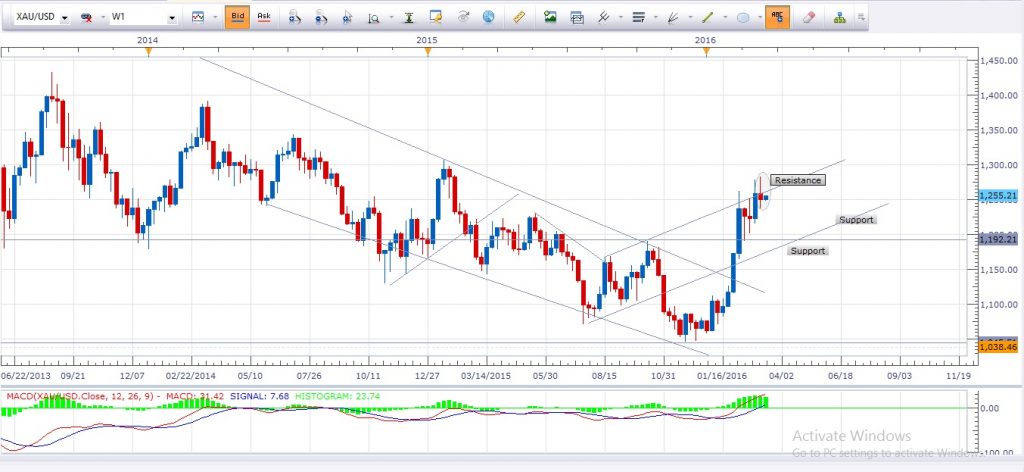
Spinning Top candle stick in weekly frame indicating a reversal from the resistance.Candle closing was also below the resistance.It seems the confusion between buyers and sellers are over and sellers may take control if gold follow the resistance and give new low below the previous week low 1231-37.The next support in weekly time frame is around 1211-13 and then 1191-93 for major support.
Invalidation : Movement and closing above the resistance 1270-80 in weekly candle closing will invalidate our bearish thoughts.I mention resistance and support areas in the chart below.
Weekly Chart
Daily Gold Analysis
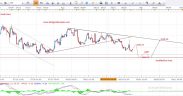
If we look at daily time frame chart.We can see a clear reversal candle bearish engulfing at the resistance level.But Friday closing was above the resistance.So we will have to wait for the confirmation , this could be the watching area for gold.If today closing will below the resistance we will keep our thought for selling gold.If Gold close above the resistance again we will remain the neural in the market and wait for the confirmation for Bullish or Bearish move.Movement and closing above the resistance will convert resistance into strong support and we may buy from the support.Break below the resistance will give us signal for selling gold with invalidation above the resistance level.I mention support and resistance areas in the chart below.Please have a look
Daily Chart

4 Hour Analysis
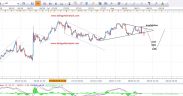
We may see the clear picture in 4 hour time frame chart.Most trades use 4 hour time frame chart to get better idea for intraday or swing trading. We can see the clear rising support around 1239-45 area.Gold is following this support since few days in 4 hour chart.As long as gold is following the support we will not go for sell entry.If we get clear break and closing below the support we will sell the gold accordingly.So its time to stay neutral in gold and wait for confirmation to jump in bullish or bearish.Please have a look in 4 hour chart below
4 Hour Chart

Note :
I will update the chart and analysis once i get the clear break or signal.I Suggest to bookmark our blog page to get back to see the updates.
Dont risk more more then 1% of your account in single trade.Adjust your stoploss and lot sizez according to money management rule.
Your comments below the post will appreciated.
Wish You Best Of Luck
Mati Ur Rehman
Gold Technical Analyst @ dailygoldanalysis.com


Thanks Alot Sir G,,,,,,