
Daily Gold Analysis 11th April 2016
Share

Good Morning Gold Traders
Last week we were bullish in gold, and we got positive moves.This week we will still remain bullish and will look for buy entry from the dips.I am sharing different time frame chart analysis to predict gold next move.Please go through the analysis written below.
Weekly Gold Overlook
We will still remain bullish in gold as long as gold is trading above the support level, we have set the support level at 1191-93 , It was previous resistance of descending channel that was forming since last few years.This broken resistance indicate declining bearish trend and we set our thought for bullish in metal.Last week closing give more confidence to our bullish bias.Current market price is 1238-39 and weekly high was at 1243.We will look for buy entry from the low.The first minor support in weekly chart is 1229-31 level and 1225-26 in extension.Gold invalidation area remains the same as per previous analysis.If gold move and close below the invalidation point 1191-93 we may change our thoughts accordingly.I am sharing weekly char below.Please have a look.
Gold Weekly Chart

Daily Gold Overlook
MACD in daily chart gaining more strength and indicating buyers may control the market soon.Previous daily candle closing was doji and it gives confusion to traders.But overall we set bullish thoughts because of weekly descending channel break. That’s the reason we will remain bullish and look for better price to enter in the market for bullish rally.Immediate support in daily time frame is at 1225-26 and second support become 1217-18 now.Invalidation point for bullish trend remains the same 1191-93.The best possible buy area is around 1220-25 and price may resist at 1249-51 level that will be our first target for gold.Next target is 1269-71 that is resistance of daily time frame.If gold fail to touch support level, we may buy gold at the break of 1243.Please look at the chart below i have mention support and resistance area.
Gold Daily Chart

4 Hour Gold Overlook
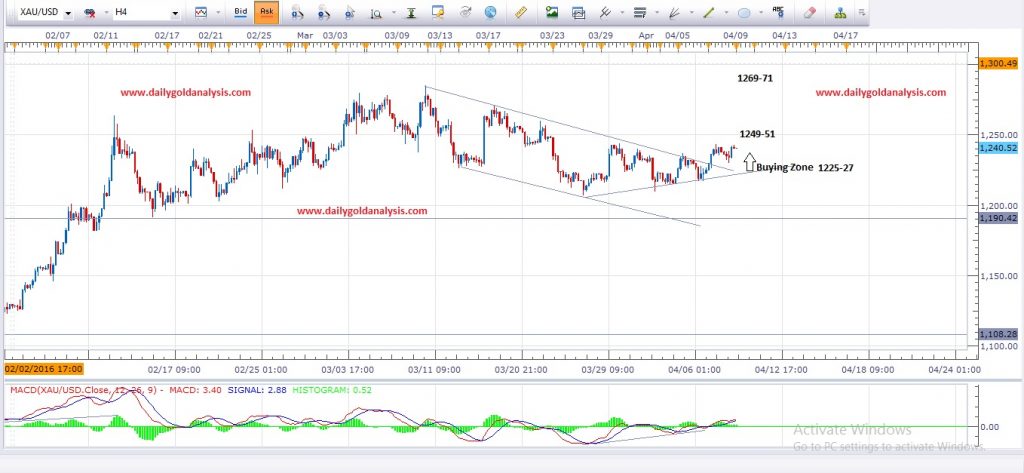
last week 4 hour descending channel break give us a new edge to buy gold from.Resistance of descending channel become support at 1225-26.Gold may touch the support before giving a new high.It may also move up without touching the support level.First target is at 1249-51 and next target may 1269-71.Movement and closing below 1215 will invalidate the break.I have mention support and possible buying area in the chart below.Please have a look
Gold 4 Hour Chart
1 Hour Gold Overlook
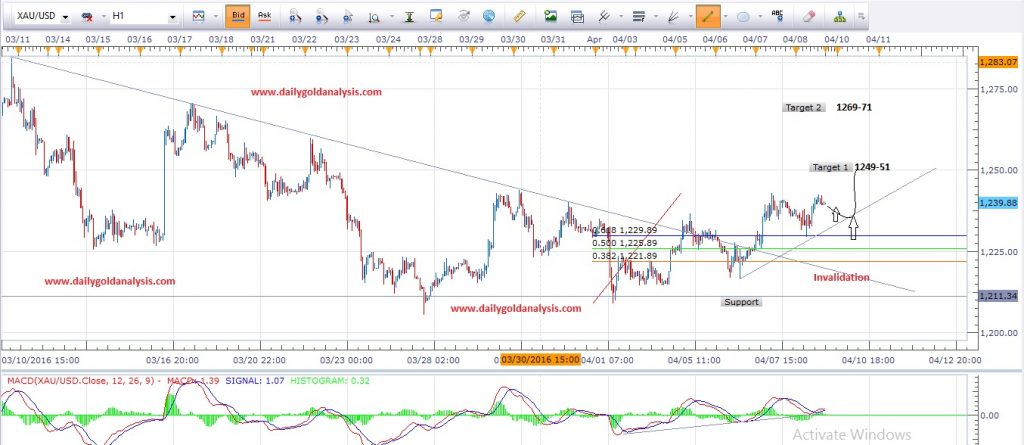
According to 1 hour chart , we can see a clear shooting star candle stick pattern that may give us short term correction towards 1230-31 and 12224-25 in extension.These are the support levels of 1 hour time frame chart.I have also set Fibonacci replacements level to predict the possible bounce area.I never ignore 1 hour chart because we can catch early move and confirmation in hourly chart.Gold next possible target is 1249-51 and 1269-71 in extension.If gold fail to reach support level then we will look for buy entry from the break of 1243 level.Targets will remain the same.I have mention support, possible buying zone and targets area in the hourly chart below.
Gold 1 hour chart
Note : Never risk more then 2% of your trade account in single trade.Always trade with proper risk management plan.
Site Announcement And Updates
We are also starting video analysis from next week.We are working to make quality videos to give better understanding of our analysis.Our team is working to start education session very soon for beginners to understand the Forex basics.Those who want pro Forex technical analysis course can contact us via email.
Trade Recommendations : Those who want our trade recommendations with proper entry and target points may contact us via email.We have set our minimum fees for the paid clients.
( Our paid clients already get nice profit from our previous week recommendations )
Forex Education : Those who want to learn forex technical analysis can contact us via email.We will start our skype classes session for interested members.
Email : admin@dailygoldanalysis.com
Skype : mati_ji
Feel free to comment below if you have any concern regarding charts and analysis.Your feedback is always welcome and help us to improve.
Wish you good luck and happy trading
Mati Ur Rehman
Gold Analyst @ dailygoldanalysis.com


