
XAUUSD | Gold Technical Analysis | Forex Trading
Share
XAU USD Gold Price Analysis ( March 2017 )
Please follow the link bellow to read our XAU USD analysis history for the month of Jan and Feb 2017.
Gold Trading Price | Gold Price Forecast | Gold Price Chart
Gold Price Today | Today Gold Forecast
Good Morning XAUUSD Lovers
In our previous week XAUUSD analysis, we expected a little bit more upward movement towards 1271 before a reversal.It didn’t happen, price moves up but fails to touch the resistance and reverse back with bearish pressure and break the major support level.Closing below the support and weekly bearish engulfing candle indicating possible bearish move for a couple of next days. I am sharing three different time frame XAUUSD chart analysis to deliver my technical thoughts for next possible movement.
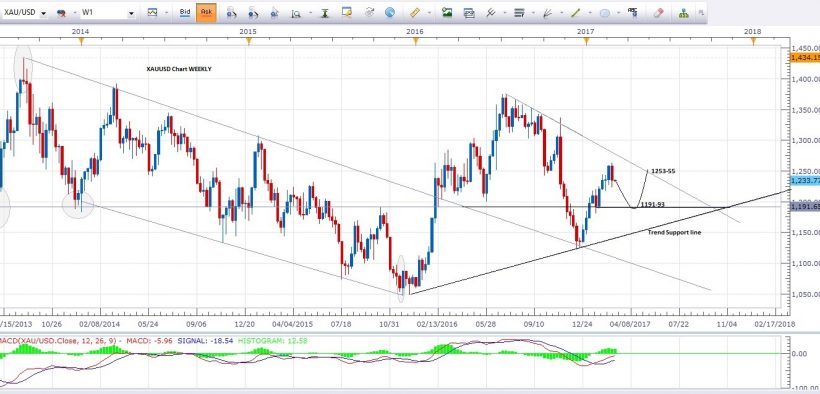
XAUUSD Weekly Forecast
Upward movement rejection before a resistance level invalidates the bullish ideas for short term.We believe gold is in correction mode now.Weekly bearish candle closing was indicating more bearish move this week towards the next support level minimum 1217 and maximum 1190-91 level which is also the weekly main support area.Gold may give little bit upward movement before a new low.The upward movement may end around 1243-45 level which is the broken support area that becomes resistance and watching area for bears.Please have a look at weekly XAUUSDchart below.
Weekly XAUUSD Chart

XAUUSD Daily Forecast
The yellow metal already break its major support in the previous daily session.Support was forming around 1239-41.According to the technical rules , “the support become resistance when it breaks” . I am expecting more downward movement towards minimum 1217 and 1201-03 in case of extension.MACD is also in favor of selling pressure which is giving more confidence towards our bearish thoughts.The best area to look for sell entry is the resistance area which was previously support.We will look for Hourly charts to get the exact entry point.Please have a look at XAUUSD daily chart below.
Daily XAU USD chart

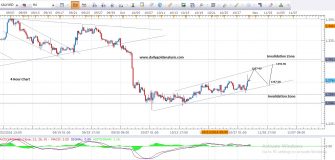
4-Hour XAUUSD Forecast
Gold was moving in a higher high direction with a rising channel formation in 4-hour and hourly charts.The break of support in previous week days invalidates the mounting structure and confirm the bearish signal for next couple of days.The rising support was around 1243-45 level which becomes resistance now.Our main thought for this week is bearish, and we will look for bearish entry from the resistance level at 1243-45. It is also possible gold may not touch the resistance level, and it can move lower without small correction towards minimum 1217 support level and maximum 1201-03 level for this week.
Alternately: If gold move higher and break the trend resistance around 1253-55 in daily frame.It will invalidate our bearish thoughts.
Please have a look at XAU USD chart below to get the logical trade idea.
4-Hour XAU USD Chart

Support & Resistance
Weekly Support: 1191-93
Weekly Resistance: 1253-55
Daily Support: 1201-03
Daily Resistance: 1243-45
Hourly Support: 1217
Hourly Resistance: 1243-45
Note: Never risk more then 2% of your account capital in single trade.Always trade with proper risk management plan.
Feel free to comment below if you have any concern regarding charts and analysis.Your feedback is always welcome and help us to improve.
Wish you good luck and happy trading
Mati Ur Rehman
Gold Analyst @ Dailygoldanalysis.com
—————————————————————————————————————————————-
—————————————————————————————————————————————-
Below is the XAUUSD Analysis History 2016
Daily Gold Analysis 24th Oct 2016
XAU USD Today Daily Time Frame Analysis
We spot a break of triangle in previous analysis , it was expecting that price will move upward towards 1281-83 minimum and 1295-96 in extension. Gold move high yesterday and close around 1275-76 which give more confidence towards our first target 1281-83.I believe this target may met today.We will look for the confirmation either price will give more upward movement for 1294-96 or it may give reversal.We will look for the reversal from 2 major areas 1281-83 and 1295-96.We will not enter in bearish position unless we get any proper reversal signal.This week closing may clear the picture for next movement diagram.I am sharing update daily chart below.Please have a look.
XAU USD Daily Chart

XAU USD 4 Hour & Hourly Time Frame Analysis
Gold is moving upwards after touching the hourly support around 1259-60 , current market price is 1275-76 and we are expecting more upward movement for minimum 1283 and maximum 1296.Price is moving in a rising channel direction in 4 hour chart.It is also possible price may touch 1271 ( support ) and then bounce back again.I am sharing 4 hour and hourly chart below with two different expected movement diagram.Both charts are indicating upward movement, but patterns are different.Please have a look in 4 hour and hourly chart below.
4 Hour XAU USD Chart

XAU USD Hourly Chart

Alternate Analysis : Movement and closing below yesterday low will invalidate today analysis
Support & Resistance
Hourly Support : 1269-71
Hourly Resistance : 1276
Daily Support : 1259-60
Daily Resistance 1281-83
Note: Never risk more then 2% of your account capital in single trade.Always trade with proper risk management plan.
Feel free to comment below if you have any concern regarding charts and analysis.Your feedback is always welcome and help us to improve.
Wish you good luck and happy trading
Mati Ur Rehman
Gold Analyst @ Dailygoldanalysis.com
very good.
Thanks for the feedback Sakthi 🙂
nice work brother. keep it up. thanks
Thankyou Imran
Excellent analysis. THANK YOU
I am following the TIP, EVEN THE GOLD IS VERY SLOW IN YOUR MOVES.
MATI, THINK LIKE GOLD Behave, IN United States presidential election.?
REGARDS
Thanks for the feedback HAMIL
I am still expecting a new high .. Gold is trying to break the barreir resistance around 1273-75.Once this level is break, you will see very good bullish move towards our targets.US election may give volatile during and after the results…But we will focus only technical set up.Our invalidation point is weekly low.If gold close below 1247 in weekly time frame , it will give us thoughts to forget the correction and jump for bearish move towards 1217-21 and 1201.
Right now it is most likely, gold will touch new high before making any majore bearish move.
Everything you blog about strikes a nerve to me, thanks
for challenging your readers.