
Daily Gold Analysis 20th May 2016
Share

Good Morning Forex Friends
Price move lower yesterday towards 1244-33 after breaking the support of 1251.We consider closing price for the confirmation of break.Price close in daily time frame candle at 1255.It is indicating that the break was just to make bottom for buyers.We are still bullish in gold as long as gold is trading above the invalidation level.I am sharing different time frame chart analysis to give my view on gold.Please go through the analysis written below.
Weekly Gold Analysis
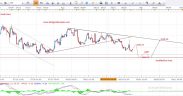
Gold is trading in a rising channel in weekly time frame chart and currently moving near to its support zone of rising channel.Gold may remain in consolidation phase around 1251-55 area for couple of days and then give a bounce for the next high of rising channel.We will remain bullish in gold as long as gold is taking care of its support.Movement and closing below the rising support will invalidate out bullish thoughts.Please see the chart below , i have mention support and invalidation with possible next move diagram.
Weekly Gold Chart

Daily Gold Analysis
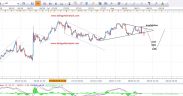
Yesterday movement and break below the support gives us short term bearish thoughts.But we were waiting for candle closing to get the confirmation for bearish move.Closing was above the support level and it gives us confidence to remain bullish in gold.We are still expecting little bit more downward movement today but it will remain above the yesterday low , today closing should above 1260-61 level to get more confidence in next possible bullish move towards 1279 and 1296 in extension.Alternately if gold break and close below the support line which is mention in the chart , it will invalidate our bullish thoughts and may take gold towards 1237 and 1225 in extension.Please have a look in a chart below
daily Gold Chart

4 Hour Gold Analysis
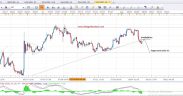
Gold clearly break its 4 hour support of rising channel yesterday.We were waiting for the daily closing to confirm the break. Logically we have two different thoughts for possible next move of gold in hourly chart. We will look for key resistance area that was previous support of rising channel.If gold reverse from the resistance 1256-59 and close below the yesterday low around 1244-43 , then we will enter for the sell trade with target 1237 and 1225 in extension.If gold fail to reverse from the resistance and close above the rising channel again 1259-61, it will gives us thoughts to remain bullish in gold for target 1279 and 1296 as per our overall expectations.Please go through the chart shared below , i have mention possible next move diagram with target and invalidation points.
4 Hour Gold Chart

Note : Never risk more then 2% of your account capital in single trade.Always trade with proper risk management plan.
Site Announcement And Updates
We are also starting video analysis soon.We are working to make quality videos to give better understanding of our analysis.Our team is working to start education session very soon for beginners to understand the Forex basics.Those who want pro Forex technical analysis course can contact us via email.
Trade Recommendations : Those who want our trade recommendations with proper entry and target points may contact us via email.We have set our minimum fees for the paid clients.
( Our trades are already trigged and open )
Forex Education : Those who want to learn forex technical analysis can contact us via email.We will start our skype classes session for interested members.
Email : admin@dailygoldanalysis.com
Skype : mati_ji
Feel free to comment below if you have any concern regarding charts and analysis.Your feedback is always welcome and help us to improve.
Wish you good luck and happy trading
Mati Ur Rehman
Gold Analyst @ dailygoldanalysis.com


