
Daily Gold Analysis 18th April 2016
Share

Good Morning Forex Fellows
Price is moving near to its support level, watching area for next possible move.We have two different thoughts with different confirmation points today.We are bullish in weekly long term forecast and may go for bearish in hourly short term move.I am sharing different time frame gold analysis with the confirmation points today.Please go through the metal analysis written below.
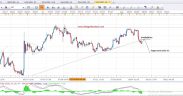
Gold Weekly Forecast
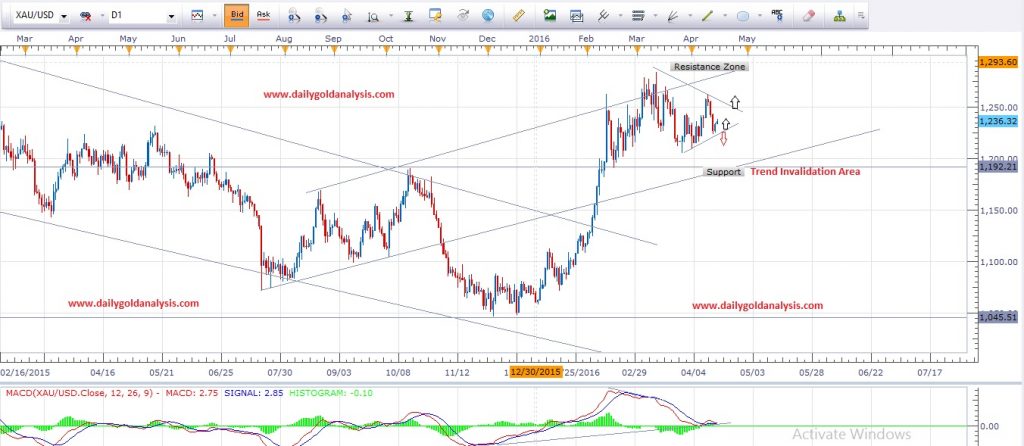
We can predict longer term overview in weekly charts.After breaking the 3 years descending channel pattern few weeks before, We set our thoughts for long term bullish scenario as long as gold is trading above the descending channel support that was previously resistance around 1190-93.Bearish candle in last week closing indicating more bearish move may hold the market but it will remain above the invalidation point.We will look for better price to buy gold with invalidation below the weekly channel support.Gold long term target is 1370-90 , Movement and closing above 1283 will give more confidence towards the target.Alternately if gold break and close below the support around 1190-93 in weekly chart,It will invalidate our bullish bias and we will change our thoughts accordingly.I have mention support , target and invalidation area in the chart below.
Weekly Gold Overview

Gold Daily Forecast
As per previous gold daily chart analysis , we discussed the possible early symmetric triangle pattern in daily chart.Support of symmetric triangle is at 1223-24 and resistance is becoming around 1249-51 area.If gold bounce from current market price and resist around 1249-51 it will confirm the symmetric pattern and we will look the break either upside or downside to catch the rally.price may move in the symmetric channel in few days to narrow the support and resistance and may give big move after the break towards 1283 for bullish and 1211-13 for bearish break.If gold fail to reach 1249-51 and move lower, then we will keep an eye at support area that is around 1223-24.If gold break and close below the support 1223-24 in daily chart then we may see gold at 1211-13 and 1191-93 in extension.Gold main trend and final support is at 1191-93.Movement and closing below this area in daily and weekly time frame chart will invalidate our overall bullish thoughts.Please have a look in a chart below.I have mention support, Symmetric triangle range and resistance area.
Daily Gold Overview
4 Hour Gold Forecast
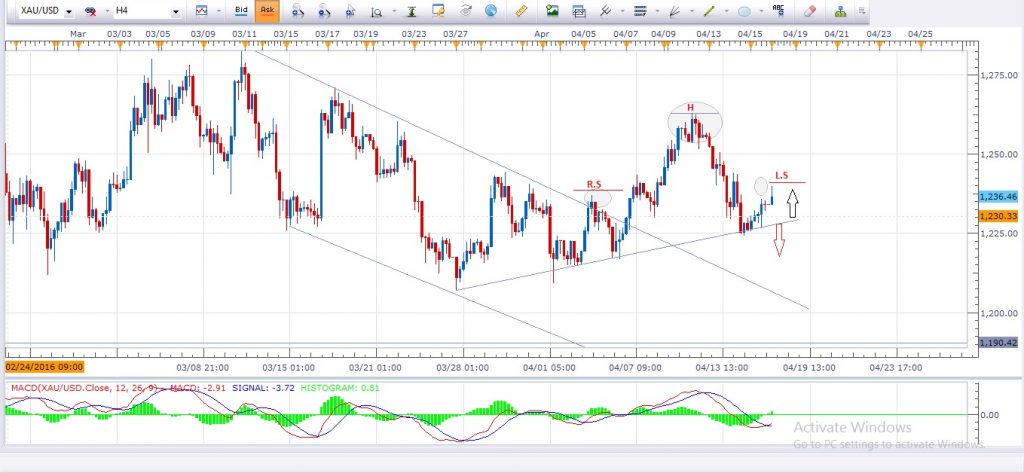
Price is bouncing from rising support of 4 hour time frame chart.gold is forming Head and shoulder pattern in 4 hour chart i have mention in the chart below.This pattern will confirm if gold give reversal from 1239-41 area.Technically if we are planning to trade head and shoulder pattern , we will have to wait for the break of neck line ( Rising support ). If gold move lower and break the rising support , it will confirm the head and shoulder pattern break and gold next bearish target may 1211-13 and 1191-93 in extension.If gold move higher and break above 1241 in 4 hour time frame chart , it will invalidate the head and shoulder pattern and the next target will be around 1249-51 area.Gold 4 hour main bullish target is 1269-71 and 1281-83 in extension.We have to look for the confirmation before jumping in the market.4 hour watching area for bullish move is 1239-41 and bearish watching area is the rising support around 1223-34.I have mention support and resistance areas in the chart below.Please enter the trade after the confirmation of break.
4 hour Gold Overview
1 Hour Gold Forecast
I never ignore 1 hour time frame chart because it gives us clear picture and signal to jump in the market.previous days we spot the support area of 1231-33 that was break in 1 hour chart.That support become resistance and physiological level to predict reversal or bouncing area.I have mention the resistance line in the chart below.if gold break and close above the resistance in 1 hour time frame chart then this resistance will become support , we will look for buy entry after the break with first target at 1241-43 ,second target at 1249-51 and 1269-71 in extension with invalidation below the support that was previous short term resistance.If gold fail to break the resistance line in hourly chart then we will look for reversal candle confirmation to jump in bearish move with target 1211-13.Please go through the hourly chart below i have mention possible next move confirmation points with targets and invalidation.
1 Hour Gold Overview

Note : Never risk more then 2% of your account capital in single trade.Always trade with proper risk management plan.
Site Announcement And Updates
We are also starting video analysis soon.We are working to make quality videos to give better understanding of our analysis.Our team is working to start education session very soon for beginners to understand the Forex basics.Those who want pro Forex technical analysis course can contact us via email.
Trade Recommendations : Those who want our trade recommendations with proper entry and target points may contact us via email.We have set our minimum fees for the paid clients.
( Our paid clients already get nice profit from our previous week recommendations )
Forex Education : Those who want to learn forex technical analysis can contact us via email.We will start our skype classes session for interested members.
Email : admin@dailygoldanalysis.com
Skype : mati_ji
Feel free to comment below if you have any concern regarding charts and analysis.Your feedback is always welcome and help us to improve.
Wish you good luck and happy trading
Mati Ur Rehman
Gold Analyst @ dailygoldanalysis.com


