
Bitcoin Price Predictions Update Feb 2018
Share

In our previous bitcoin analysis, we had 2 expectations, a bounce from the support or break the support.
Bitcoin breaks the support in today session and 4-hour closing below the support invalidate our bullish thought today.
According to the technical rules, ” Support Become Resistance When It Breaks ”
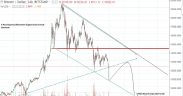
So we will consider the broken support as a resistance point for next movement. Current bitcoin price is 8926$ and I am expecting a little bit more downward movement before a correction. This downward movement may touch the extreme support 8300$ and then we may see a rise in bitcoin price for the correction towards the resistance level ( Broken support line ) which is around 10700-800 level.
The bitcoin could fall again after this correction and the next target could be 6700$ and 5300$ in case of extension. These levels are also the support levels of descending channel forming in 4-hour chart.
What is Descending Channel? When price move in a direction making the higher low and lower low in a specific range and respect its support and resistance level, this kind of pattern is called descending channel. The example of descending channel is shown in the chart diagram below.
We couldn’t expect a long-term bullish move until price will break this channel resistance clearly.
Alternative: If price moves above and close above the broken support level again, then it will invalidate our bearish thought and may move in previous channel formation, in this case, the bitcoin still find its extreme resistance around 12800-900 and the chances for this scenario is too low.
Note: Investors who are buying bitcoins for the expectations of 20000$ again. Please review your strategy because bitcoin will face 3 to 5 strong resistance levels from 10k to 13k.
Please have a look at bitcoin 4-hour chart below, I have created a possible movement diagram with the channel formation only for studies purpose.
Bitcoin Price Predictions Update 4-hour Chart

Bitcoin Suppor & Resistance Levels
Support 1: 8300-100
Support 2: 6700
Support 3 : 5300
Resistance: 10700-800
Wish you good luck and happy trading
Join Our Telegram Channel For More Updates
Gold Analysis Telegram Channel
Note: Never risk more than 2% of your account capital in single trade.Always trade with the proper risk management plan.
Feel free to comment below if you have any concern regarding charts and analysis.Your feedback is always welcome and helps us to improve.
Wish you good luck and happy trading with Gold Technical Analysis
For Gold Price Predictions Please Click here
Mati Ur Rehman
Gold Analyst @ Dailygoldanalysis.com


