
Bitcoin Price Prediction January 2018 | BTC Technical Analysis
Share
Bitcoin Technical Analysis
Bitcoin is trading near 14800 level after touching its resistance level around 17300.As per the weekly and daily time frame chart, the bitcoin price predictions are bearish, and it could move in a triangle range formation.
I am sharing 4 Hour timeframe bitcoin analysis to give my view about BTC next move.
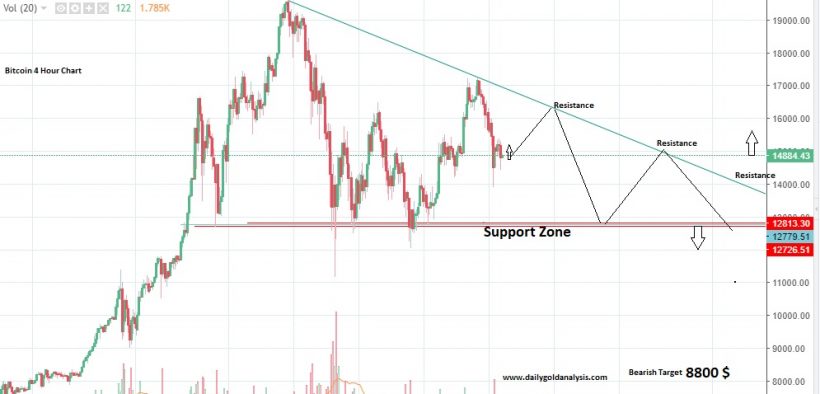
Bitcoin Price Forecast 4 Hour Time Frame Analysis
I can see a clear Bearish Descending triangle in a bitcoin movement which is indicating more selling in coming days.
The first resistance of descending triangle was at 17300 level and the support is around 12800 level which was hit twice in previous weeks movement.
The beauty of bearish descending triangle is that the resistance becomes narrow with the price movement and I am expecting bitcoin may bounce from its support again at 12800 level and it could hit the descending resistance level 15800-16000.
I am sharing 4 -hour bitcoin price chart below, I have mentioned the possible movement diagram and some bitcoin target levels for the understanding purpose.
Bitcoin 4-Hour Price Chart Analysis

Note: I will share the long-term target with details in my next analysis.
Wish you good luck and happy trading
Join Our Telegram Channel For More Updates
Gold Analysis Telegram Channel
Note: Never risk more than 2% of your account capital in single trade.Always trade with the proper risk management plan.
Feel free to comment below if you have any concern regarding charts and analysis.Your feedback is always welcome and helps us to improve.
Wish you good luck and happy trading with Gold Technical Analysis
Mati Ur Rehman
Gold Analyst @ Dailygoldanalysis.com


