
XAU/USD Gold Price Technical Analysis 3rd Nov 2016
Share

XAU/USD Gold Price 3rd Nove Update Analysis
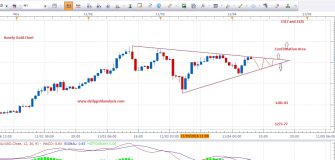
we expected gold will touch its resistance 1301 yesterday.Gold move little bit more high and cross the resistance and made high around 1308-09 , But close below the resistance.This give us confidence to stay bearish in gold and we were looking for reversal confirmation from the resistance area.Couple of reversal candles in 4 hour chart indicating bearish move.Next support of gold is around 1281 and 1273-74 in extension.Gold may bounce again from the support levels.If gold fail to bounce and break its support in hourly charts, this will be the earliest confirmation for longer term bearish target which we mention in previous couple of analysis.Alternately if gold break yesterday high 1308-09 in hourly chart, then it may give another high towards trend resistance at 1323-25 which may b the best price to sell gold again from peak , This resistance area is mention in the chart below.
Note : We are bearish with minimum target 1285 and maximum 1273. We will only take bullish trade once gold break its trend resistance 1323-25.
4 Hour XAU/USD chart

Gold Price Support & Resistance
Hourly Support : 1285-86
-Hourly Resistance : 1308-09
Daily Support : 1273-77
Daily Resistance 1323-25
Note: Never risk more then 2% of your account capital in single trade.Always trade with proper risk management plan.
XAU/USD Analysis ( 2nd November )
As per our previous analysis, gold move exactly according to our expectations and move higher in yesterday session and hit our final target area around 1291-93.I believe gold will may give little bit more upward movement to complete its move , because there is still enough momentum to retest the resistance area , which was previously trend support.Watching area is 1295-1301 for reversal signal.Today we will discuss the possible reversal areas and invalidation points in the XAUUSD analysis below.I am sharing weekly , Daily and hourly analysis to get the better picture of next move.
Please visit previous analysis to find out how we predict the market technically
Gold Price Today 31st Oct 2016
XAUUSD Weekly Analysis
Gold is in correction mode after hitting a new low 1241-43 couple of weeks before.It was expected this correction may end around 1295-97 in our previous week analysis.Gold move higher towards its final resistance area.Current market price is 1291-92 and we believe XAUUSD will give more upward movement to complete its correction.Now the watching area is theresistance which was previously strong support of trend around 1297-1301.We have two different thoughts logically in weekly view.Gold may touch 1301-05 area this week and close below the resistance to gain the confidence for sellers Or it may reverse directly from 1295-97.We will suggest to wait for weekly closing to get the clear pictue.Alternate if gold move and close above the resistance area or resistance line which i mention in the weekly chart below.It will be the confirmation of bullish continusion pattern.In that case we have to change our thoughts from bearish to bullish.Please have a look in a weekly gold price chart below.
XAUUSD Weekly Gold price Chart

XAU/USD Daily Analysis
Gold move more high in yesterday session and trading near to our final target level.Current market price is 1291-92 and we are expecting more upward movement towards 1296-97 and 1301 in extension.There is still enough volume for buyers to hit the extreme resistance area 1297 or 1301 level.We will not take any step unless we get the proper reversal signal from the resistance area.As per technical expectations we will look for reversal from previous broken support area which is resistance now.1297-1301 is the watching area.Daily closing above 1301 may invalidate our technical analysis, where as reversal from the resistance area and closing below the resistance will give more confidence to our bearish thoughts.We will look for better and earliest entry point in the 4h chart.Please have a look in a daily gold chart below, i have mention possible movement diagram.
XAU/USD Daily Technical Chart

XAU/USD 4 Hour Analysis
We love to share 4 hour chart because it gives us closest picture and help us to spot earlies reversal or trend signal.Gold is trading near to its resistance level in 4 hour time frame chart.I have also added fibonacci tool in the 4 hour chart today which will support our decision for the next move.Gold extreme resistance is 1297-1301, It can also give reversal signle from 1295-97 area.We will look for the selling entry from the peak area with the minimum target 1275-77.
Alternately if gold break and close above the resistance line which is mention in the hourly chart below, It will invalidate our hourly point of view.Please have a look in the 4H gold chart below to get the closest picture.

Invalidation : Movement and closing above the resistance 1301-05 area in the weekly time frame will invalidate our bearish point of view and may change our thoughts from bearish to bullish for longer term.
Gold Price Support & Resistance
Hourly Support : 1275-77
-Hourly Resistance : 1295-97
Daily Support : 1275-77
Daily Resistance 1297-1301
Note: Never risk more then 2% of your account capital in single trade.Always trade with proper risk management plan.
Feel free to comment below if you have any concern regarding charts and analysis.Your feedback is always welcome and help us to improve.
Wish you good luck and happy trading
Mati Ur Rehman
Gold Analyst @ Dailygoldanalysis.com
Marti thanks for analysis.
on the graph paper it says that the support is 1275, this means that will return to bounce (technically) at that point and then touch resistance 1297-1301?
regards
Yes we have to look 1297-1301 area to see the reversal confirmation pattern…Once it is confirm then the next support will be around 1275-77
Hi closing below 1301 yesterday. Waiting for today analysis. Thanks
excellent analysis. Greetings.
Thanks Hamil 🙂
Hello Mati.
Mati you think of the presidential elections in the United States on November 8.
As you can react gold, if Clinton wins or otherwise earn Trump?
regards