Gold Technical Analysis Today 20th Jan 2019
Share

In our previous analysis, The bullish movement was expected as per the trend, The prices move exactly according to the analysis and made a high around 1301, however, we were expecting a high around 1281-83. The price moves little higher than our predictions.
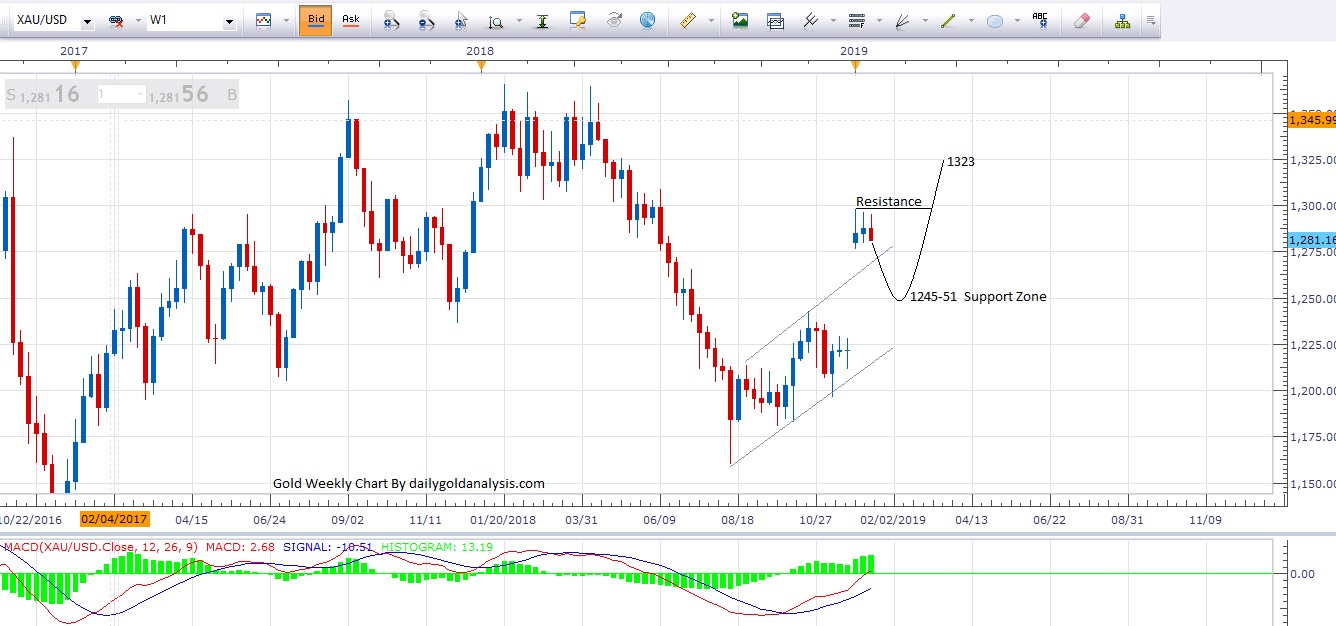
The trend is still bullish but we may see a small correction before a new high. I am sharing a weekly technical analysis to give my thoughts about the possible next movement.
Weekly Technical Analysis
A couple of reversal candles and a weekly closing indicating a bearish move and it may be a start of correction towards minimum 1261 and 1245 as an extension.
Movement below 1279 may confirm this move.
The price could move for a new higher after this correction and we will look for the bullish entry from 1245 level. The confirmation of bounce may b discuss once the price hit our expected target level.
Please have a look at the weekly technical gold chart below, I have drawn a possible next movement diagram with target levels on it.
Weekly Gold Technical Chart

Support & Resistance
Support 1 : 1279
Support 2 : 1261
Support 3 : 1245-51
Resistance 1 : 1301
Resistance 2 : 1323
Note: Never risk more than 2% of your account capital in a single trade. Always trade with the proper risk management plan.
Feel free to comment below if you have any concern regarding charts and analysis. Your feedback is always welcome and helps us to improve.
Sponsor :
* This is a telegram link to the telegram bot where you can explore automated Forex trading strategies and start making smart money 10%+ per month on your deposit. https://t.me/snt_int_bot?start=643480533
If you have any questions, please reach out to my personal telegram account directly at @ArtiSAi
Serious inquiries only, it is not Ponzi schemes or any crap like that, only pure automated Forex trading. *
Thanks!
Wish you good luck and happy trading with Gold Technical Analysis

