Gold Technical Analysis 29th Oct 2020
Share

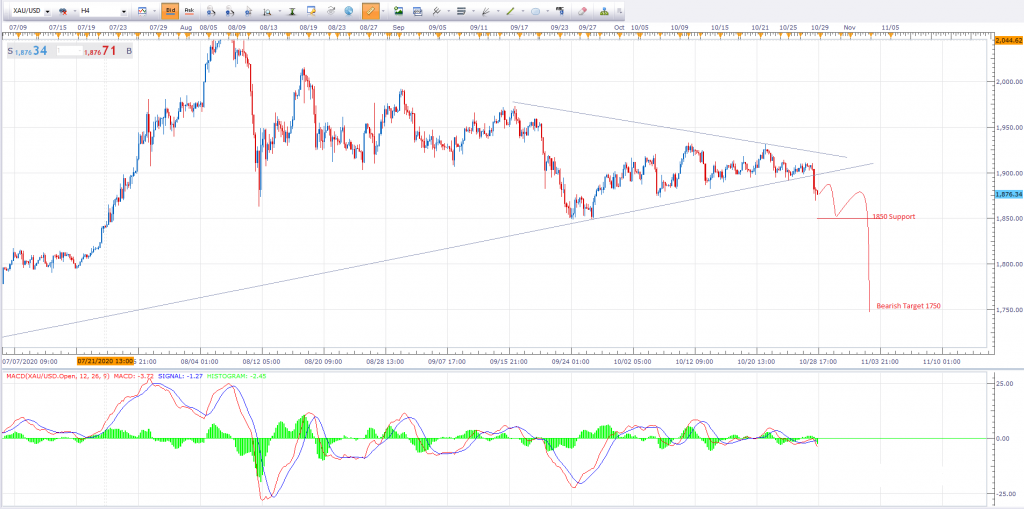
Gold has recently break its symmetric triangle resistance after a significant bullish trend.
The Break of symmetric triangle is indicating a bearish trend. We could see gold around 1750 zone in couple of week.
If you want to learn what is Symmetric triangle, feel free to visit Speedup Forex for educational purposes.
I am sharing 4-hour Technical detailed chart to share my view.
XAUUSD 4-Hour Technical Chart
After a huge bullish trend , Gold was trading in a side ways in a range of symmetric triangle from couple of days.
The beauty of symmetric triangle is , it can break anywhere either upside or downside, But when it breaks it gives a powerful signal for next direction.
We can clearly see the break of symmetric triangle in a chart below , The price breaks around 1896 area and currently trading at 1876.
The next support is at 1850 which could be the first bearish target. However according to the size of symmetric triangle , this bearish move could lead towards minimum 1750 area.
Our longter term XAUUSD target is 1750 as shown in the chart direction below.

Support & Resistance XAU-USD
Resistance : 1896-97
Support : 1850
Support 2 : 1750
Note : Never risk more then 5% of your total capital in a single trade and always take decisions based on risk management rule.


