
Gold Price Forecast Falling Wedge Pattern Formation
Share
Gold Price Forecast 10th May 2017 ( Update )
Falling Wedge Formation in 4-hour Gold Chart
We expected a correction in our last analysis, But it did not happen and gold moves lower without any correction.
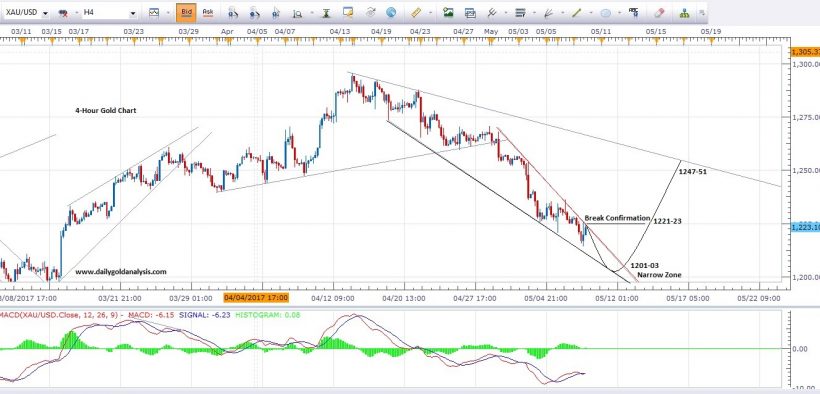
The Higher low and lower low formation indicating a falling wedge pattern due to its narrow range.Gold is trading near to its extreme support level.
The falling wedge pattern could break from a 1201-03 level which is also daily and weekly support area.
Gold may bounce from the support level towards minimum 1221-23 and maximum 1247-51 according to 4-hour gold chart.
My suggestion is to stay neutral until gold breaks its narrow resistance level. The bullish rally with huge volume may start after the break of narrowing resistance.
Please have a look at 4-hour update gold chart below, I have mentioned possible next bullish target areas.
4-Hour Gold Price Chart

Gold Price Forecast 4Hour Chart 10th May 2017
Gold Support & Resistance Levels
Resistance 1: 1223
Support 1: 1211
Support 2: 1201-03
Wish you good luck and happy trading
Join Our Telegram Channel For More Updates
https://telegram.me/dailygoldanalysis
Note: Never risk more than 2% of your account capital in single trade.Always trade with the proper risk management plan.
Feel free to comment below if you have any concern regarding charts and analysis.Your feedback is always welcome and helps us to improve.
Wish you good luck and happy trading with Gold Technical Analysis
Mati Ur Rehman
Gold Analyst @ Dailygoldanalysis.com


