
Gold Forex Forecast | Gold Forex Prediction | Buy Sell Gold
Share
Gold Forex Forecast
Good Evening Forex Friends
9th Dec 2016
As per the previous analysis, broken resistance become support and we were looking for the bullish move from the support area 1171-73.The gold move lower and touch the channel support around 1170-71 but fail to bounce from the bottom.Price is moving in a sideways direction but above the support level.As mentioned in the chart below, this support area is falling support, and also the resistance of previous broken channel.As long as the price will stay above the channel, it is possible gold will move lower but it will remain above the falling support line.Bounce will take gold towards the 1201-05 minimum, and we will look for next entry after hitting our first target.
It is also expected price may move in a sideways direction for couple of weeks because of its closing month and market will less volatile.We may get a huge bounce and big bullish rally in the start of new year.i will discuss my detailed analysis with updated charts next week.
Please have a look in hour gold chart below.
 8th Dec 2016
It was expected for bullish move in gold, and the confirmation area was around 1171-73.Gold break its resistance and confirmation area today.Made new high around 1180, it gives us confidence for our bullish thoughts.According to technical rules, Resistance becomes support after a breakout. So 1171-73 become support for gold buyers.We are expecting minimum target 1201 for next couple of days.Please have a look at a gold chart below. I have mentioned possible next movement diagram.

Support & Resistance
Hourly Support : 1171-72
Hourly Resistance : 1180-81
6th Dec 2o16
Yesterday Gold Forex Forecast has expected little more downward movement below a new bounce.This is exactly what happened, Gold move lower and made a low around 1156 , Our target was 1155 which was almost done and We got a clear bounce towards the first resistance at 1271-73 area.This gives us confidence for bullish thoughts and trend reversal.Today I am sharing 1 more confirmation area which will give us more confidence towards our bullish thoughts.Movement and closing above 1275-77 will confirm the bulls rally and our first target will be around 1201-05 and then 1225-27 in longer term extension.
(Bullish Divergence in 4H chart gave us earliest signal for this movement )
Please keep in mind , Gold almost completed its bearish movement.It is also expected it may touch again 1255-57 level before a bounce but it is our alternate thoughts.
Movement and closing below 1249 will invalidate our bullish thoughts in hourly chart.
Please have a look in update 4-hour gold chart below.I have mentioned possible next movement diagram with confirmation and invalidation areas.

Support & Resistance
Hourly Support : 1155-57
Hourly Resistance : 1175-77
5th Dec 2016
In our previous week analysis, XAU USD Idea Today we were expecting a maximum low around 1151-55 , Gold move downside in previous week session and made a low around 1160-61 area.Our target was not met. We believe gold will touch its support level 1151-55 this week.This area is also a support zone of weekly trend.I am sharing 3 different time frame chart analysis to share gold forex forecast of this week.Please go through the analysis written below.
Weekly Gold Forex Forecast
Gold is trading near to its support zone in weekly time frame chart.We expected 1151-55 level in previous week session.Gold touch 1161 and bounce back which gives us bullish thoughts for a shorter time frame.We are still expecting 1151-55 level before a bounce.1151-55 a level is also the support of weekly trend.It is also the support level of broken resistance of ascending channel that was forming since few years and broke a few months back.This is the reason we believe 1151-55 is the strong support level and bounce area.Alternate if gold moves more lower and closes below the invalidation zone which is mention in the chart below.It will be the earliest indication of bearish trend continuation.Movement and closing above 1201-05 will give more confidence of trend reversal.Gold weekly target after the bounce may around 1249-53 for the longer term and 1201-05 for a shorter term.Please have a look at a weekly gold chart below.
Weekly Gold Forex Forecast Chart

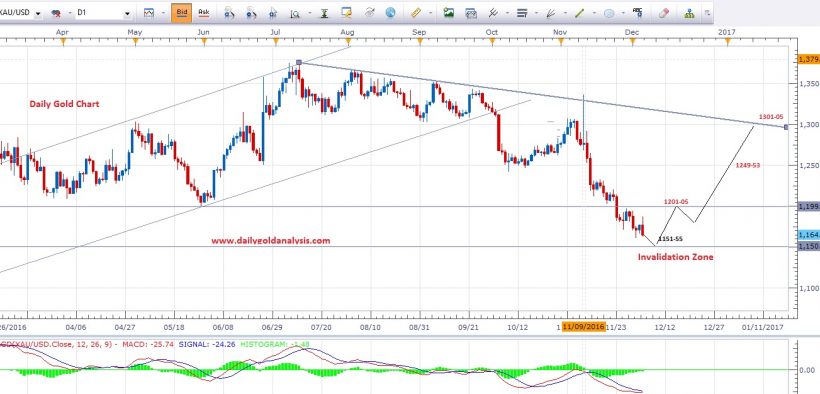
Daily Gold Forex Forecast Analysis
Bearish movement after a couple of small bulls candles indicating the price may touch its extreme support in a couple of days.We are expecting 1151-55 level to be met this week.1151-55 the level is also the psychological levels for bulls and we may have the good opportunity to buy gold from the extreme support zone.Movement and closing below the support will invalidate the bounce signal. In case if gold moves high without hitting the support level , we will look for the confirmation of reversal after the break of first daily resistance which is a 1201-05 area.Lower time frame chart like 4h or hourly gold chart may help us to catch earliest reversal movement.Please have a look at a daily chart below, I have mention possible bounce area and invalidation zone.
Daily Gold Forex Forecast Chart

4H
Love to share 4-hour gold analysis , because it gives us earliest buy or sell gold signal.We can see a divergence forming in 4-hour time frame chart which is the earliest indication of the trend reversal.Movement and 4h closing above 1177-81 will confirm the divergence signal, whereas we will also look for buy entry from the major support zone 1151-55.In case if we miss the entry at support area, then we will look for the break of resistance around 1177-81 to jump in possible bullish rally towards the 1201-05 minimum.Gold longer term bullish target after the break of 1201-05 may around 1249-51, which is logically described in the daily chart above.
Please have a look at a 4h chart below for divergence confirmation.

Support & Resistance
Hourly Support : 1151-55
-Hourly Resistance : 1177-81
Daily Support : 1151-55
Daily Resistance 1201-05
Note: Never risk more than 2% of your account capital in single trade.Always trade with the proper risk management plan.
Feel free to comment below if you have any concern regarding charts and analysis.Your feedback is always welcome and help us to improve.
Wish you good luck and happy trading
Mati Ur Rehman
Gold Analyst @ Dailygoldanalysis.com

Would be great if we had two channels in Telegram, one for the signals, and one for general discussion.
Great Idea
We will create another channel for general discussion.I will share the link soon
It would be awesome!
By the way your analysis are great… well explained and clear. Keep going on
Thanks for the feedback .Feedback is the breakfast for us 😉
I am also starting step by step from basic to pro level forex education episodes in the blog.
I hope it will help everyone to understand and learn how to analyse the market easily
Thanks Rahman, looking forward for forex education
Hello Sir Mati Ur. Please re-check your description on 8th December idea, is it typo 127,1273 & 1280? If you dont mind, can you provide your telegram personal message? Its hard to communicate thru blog.
And also on the month too. Now is december.
can back bouns gold or not after 1177 0r 1184 Mati????
1163-64 is the possible bounce area and the rising channel support.Gold next target may 1201 according to weekly and daily resistance.I will update my chart prediction tonight.
Thanks for your comment