Gold Forecast Today
Share

Gold Price Predictions 22nd May 2017
The trend is bullish and we expected bullish movement in our previous gold forecast.Gold Price move exactly according to the expectations and hit the target 1247-51, However price move a little bit more up which was not predicted.
XAUUSD is moving near to its resistance zone and we have a couple of watching levels today to get the confirmation of next move. I am sharing three different
I am sharing three different time frame technical analysis below, Please read the below-written analysis.
Weekly Gold Forecast
As per the previous analysis, gold moves exactly according to the expectations and hit our weekly target which was 1247-51 level.Gold is trading near to its resistance zone in a weekly time frame chart.The next possible resistance in a weekly range is around 1273-77 level. According to the weekly time frame chart, the gold could reversal from 1273-77 which is also the watching interest area for bears.
Reversal from the resistance zone could take gold towards minimum 1240 but we need to confirm this reversal area in daily and hourly charts.
Please have a look at the weekly gold chart for an overview.
Weekly Gold Forecast Chart
Daily Gold Forecast
Gold look bullish on a weekly time frame chart, we need to look for reversal pattern from the resistance level.Selling from the best price is the key to getting maximum gain.
The watching area to see the reversal signal is forming around 1273-77 zone which is also weekly and daily resistance.Current gold market price is 1253-54.Gold may move slow for a couple of next days to complete its range towards 1273 level.
Alternately if gold fail to move above and break 1243-44 level in a daily time frame chart.This could be the earliest indication for bearish confirmation and the target may b around 1227-28.
Please see the daily chart below, I have drawn a possible movement diagram with invalidation and alternate suggestion.
Daily Gold Forecast Chart
Hourly Gold Forecast Chart
As usual !! Hourly chart is love 😉
We love to share hourly chart because it gives us earliest confirmation and the best price to enter the market.We will look for the best entry and confirmation zone in hourly chart.
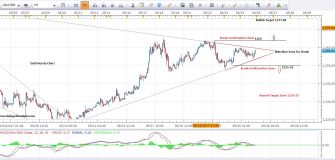
The gold is respecting its support level overall in hourly chart. Here we get to clue for the entry and confirmation point watching hourly chart. The rising support in an hourly chart has a great value in the below chart.We will look for a bearish move once the gold breaks the rising support level mentioned in the chart.However, the trend is bullish we will not take a bearish trade unless the break is confirmed.
The minimum target after the break could be 1251-53 and maximum 1243 area.
The two possible watching zone are 1261 and 1273
Please have a look at an hourly gold chart below to get the possible trade idea.
Hourly Gold Chart
Wish you good luck and happy trading
Join Our Telegram Channel For More Updates
https://telegram.me/dailygoldanalysis
Note: Never risk more than 2% of your account capital in single trade.Always trade with the proper risk management plan.
Feel free to comment below if you have any concern regarding charts and analysis.Your feedback is always welcome and helps us to improve.
Wish you good luck and happy trading with Gold Technical Analysis
Mati Ur Rehman
Gold Analyst @ Dailygoldanalysis.com


