
Gold Forecast Technical Analysis 2018
Share

XAUUSD Gold Forecast & Predictions 2018
Good Evening Forex Friends !!
In our last Gold Forecast, it was expected gold could move lower towards 1280. Gold move down but fail to sustain 1280 level and drop below 1238. It was the weekly support level.
In Today’s gold predictions, I am sharing weekly and daily gold price technical analysis to get the overview of next possible move.
Please go through the analysis written below.
Those who have not checked our previous gold history can visit the link here: Gold Forecast History.
Dunia Finance Personal loan UAE
Weekly Gold Forecast
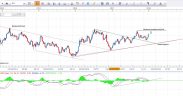
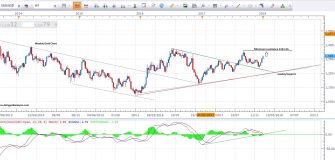
Current market price of gold is around 1284-85 level, after hitting the support level XAUUSD bounce and moving in a bullish range towards next resistance level. The weekly minimum resistance is at 1297-1301, we are expecting gold may touch 1301 level before a new correction.However, we will also look for daily time frame chart for the confirmation.
Please have a look at the weekly gold chart below, I have mentioned possible movement diagram.
The long-term target for gold is 1373-75 which will discuss in our next week analysis.
Weekly Gold Price Chart December

Daily Time Frame Gold Predictions
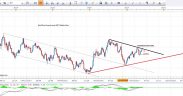
After bounce from the support area, gold moves high towards its resistance level.The minor resistance was at 1279-81 area which was broken yesterday. According to the technical rules, resistance becomes support after it breaks.
The gold is moving above the resistance level, and it may touch the minimum target around 1297-1301 before a correction.
However today closing is also very important, if gold moves back and close below the support level 1279, then it may touch its next support again around 1241-45, but the chances are not high.We will remain bullish as long as gold is respecting its support levels.
Please have a look at a daily gold chart below, and i have mentioned possible next movement diagram with long-term target levels.
Daily Gold Price Chart December

Note: I will share the long-term target with details in my next analysis.
Wish you good luck and happy trading
Join Our Telegram Channel For More Updates
Gold Analysis Telegram Channel
Note: Never risk more than 2% of your account capital in single trade.Always trade with the proper risk management plan.
Feel free to comment below if you have any concern regarding charts and analysis.Your feedback is always welcome and helps us to improve.
Wish you good luck and happy trading with Gold Technical Analysis
Mati Ur Rehman
Gold Analyst @ Dailygoldanalysis.com


Appreciate your analysis, Thanks