
Daily Gold Analysis 29th August 2016
Share
Gold Forecast 29th August 2016
In our previous gold forecast , we were looking for the confirmation of break either upside or downside.Gold move lower and break the support of symmetric triangle and hit our previous gold target with a low around 1317-18 level.I believe gold doesnt complete its bearish move and it may hit the maximum target 1301 this week.I am sharing 2 different time frame gold prediction chart.Please go through the gold technical analysis written below.
Daily Gold Forecast
Gold is trading near to its support zone in daily time frame chart.Long wick bearish candle in friday session indicating more bearish move in couple of days.XAUUSD gold current market price is 1321-22 level.Gold can give small correction before touching its major support.This correction may end around 1327-31 and it could move lower towards 1311 or 1301 in extension, which may b the best price to buy gold.Please have a look in a daily time frame technical chart below, i have mention possible gold support and movement diagram.It will help gold investors where to buy gold.Movement and closing below the support area will invalidate this gold forecast.
Gold Daily Support is at 1311 and 1301
Gold Daily Resistance is at 1341-43
Daily Gold Forecast Technical Chart

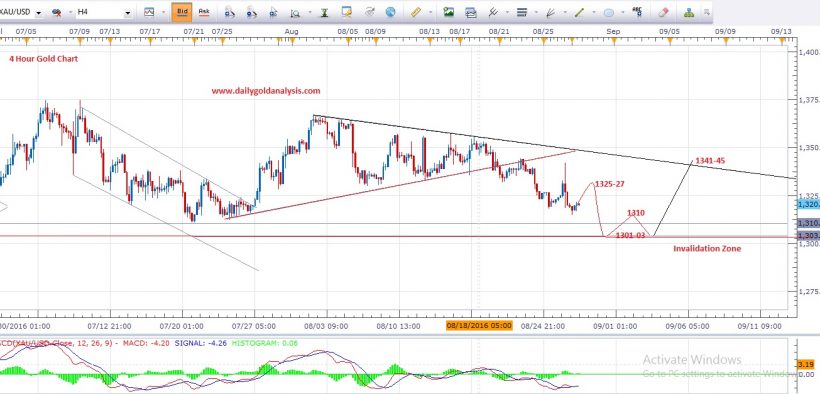
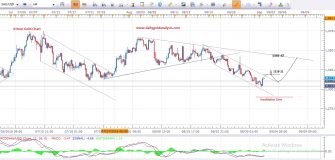
4 Hour Gold Technical Analysis
After breaking the symmetric triangle in hourly chart , Gold move lower towards its target we discussed in previous gold analysis.XAUUSD current market price is 1321-22 and we may see some correction before a new low.Gold minimum target for correction is around 1327-31 level, sellers may jump from 1327-31 towards gold final bearish target at 1311 and 1301-03 in extension which is also the major trend support of gold and the best level for gold buyers.Please see the hourly technical chart below, which help traders how to trade gold in hourly time frame.
Gold Hourly Resistance is at 1327-31
Gold Hourly Support is 1317-18
Gold Trend Support is at 1311 and 1301.
4 Hour Gold Technical Chart

Note: Never risk more then 2% of your account capital in single trade.Always trade with proper risk management plan.
Please join our Telegram Channel for Trade Updates & Alerts
https://telegram.me/dailygoldanalysis
Feel free to comment below if you have any concern regarding charts and analysis.Your feedback is always welcome and help us to improve.
Wish you good luck and happy trading
Mati Ur Rehman
Gold Analyst @ Dailygoldanalysis.com
Email : admin@dailygoldanalysis.com
Skype : mati_ji


