
Daily Gold Analysis 30th March 2016
Share
Good Morning Gold Fantasies
Yesterday analysis we were expecting bullish move with target 1237-41.Gold move exactly according to our expectations and hit our first target.I am expecting a little correction before heading up the second target that is 1249-51 area.Those who are in the trade , i suggest you to close half position and move stoploss to entry point and enjoy risk free trade.I am sharing different time frame chart analysis for possible next move prediction.Please have a look below.
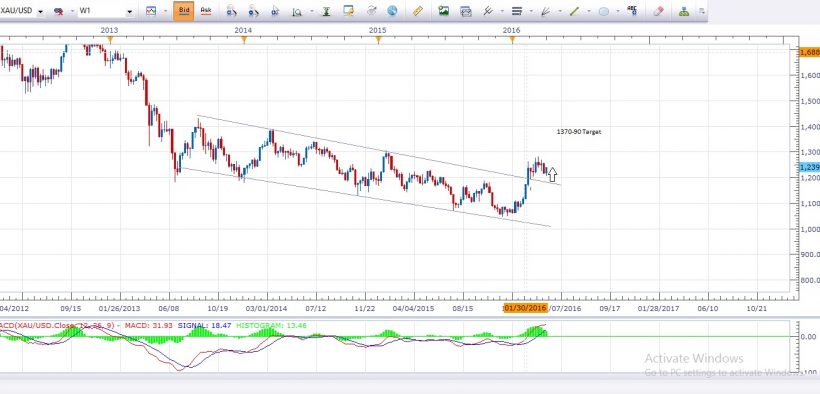
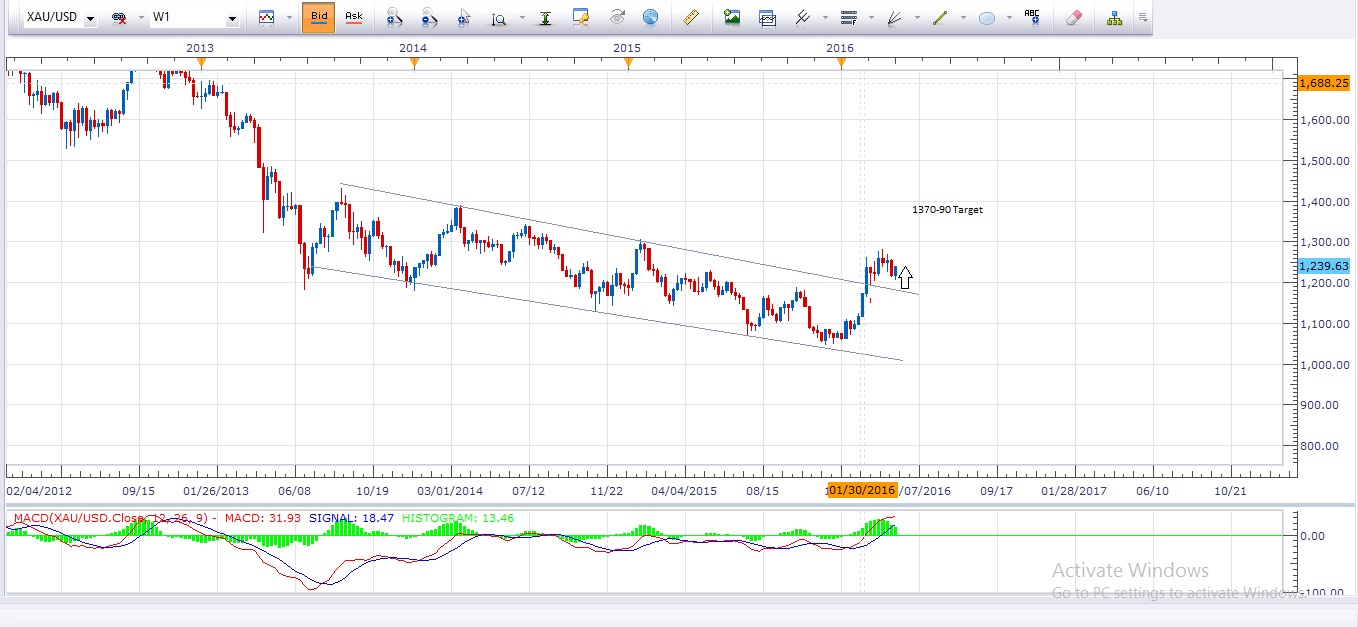
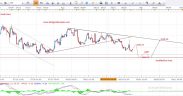
Weekly Over Look
As per our previous analysis , We are bullish in gold because metal recently break the descending channel in weekly chart and we were expecting a bounce from support.This is exactly what happen.Gold bounce near the support and heading up.Longer term weekly target for gold is 1370-90.Movement and closing above 1280-85 will give more confidence for our target.Gold weekly support is at 1190-93, If gold close below the support in weekly time frame , that will be indication to change our thoughts from bullish to bearish.I have mention support and the target area in a weekly chart below.
Weekly Chart
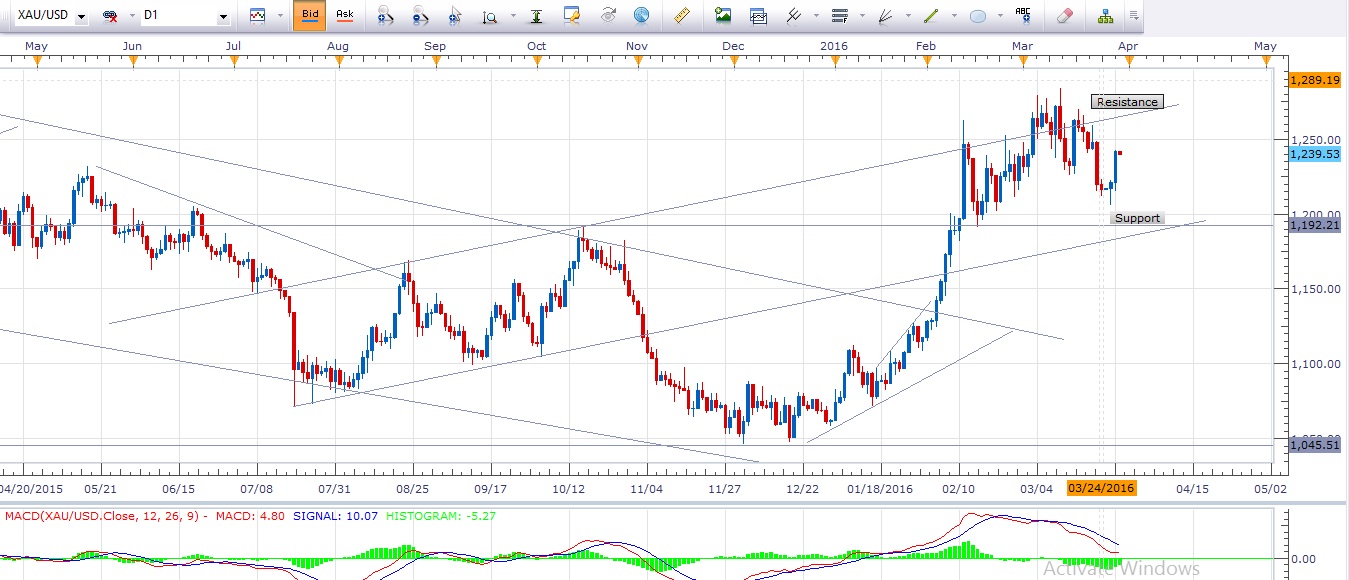
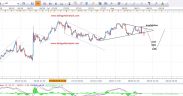
Daily Chart Analysis
Yesterday hammer closing in daily time frame works and gold follow the bullish move as per expected.Today closing is at 1241 level.Gold may give more bullish move today.We need to catch the rally from more better price.I am expecting a little correction towards 1229-30 level.Movement and closing below 1214-15 level will invalidate this bullish trade in daily time frame.Over all the trend is up , we will look only buy entry from the lows and daily resistance is at 1269-71 level, This might be our next target after hitting 1249-51 level.Gold main trend support remains the same 1191-93.Movement and closing below the support will invalidate bullish trend.I have mention some support and resistance spots in a chart below.
Daily Chart
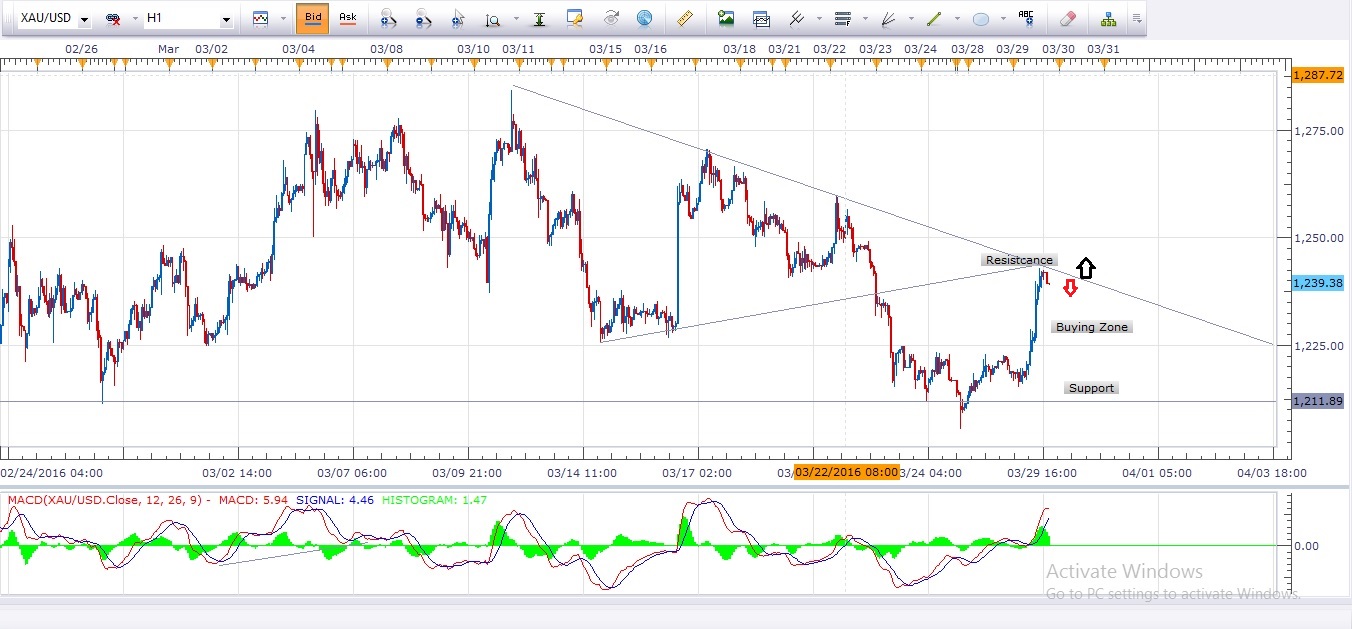
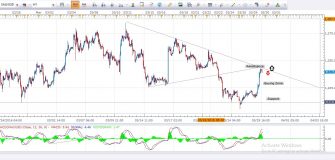
1 Hour Time Frame Chart
I always prefer 1 hour time frame chart to get close picture , it gives us possible early signal to enter the market.According to 1 hour analysis gold is at its physiological declining resistance level.Gold may give correction from this resistance to the next support that is around 1229-30.We prefer to wait for the correction.If gold doesn’t give a correction then we will enter in the market after the break of 1 hour resistance.I mention the resistance and buying zone in a chart below.Resistance will be the watching zone today.If gold break the resistance then we may see gold at 1249-51 and 1271-73 in extension.
1 Hour Chart
Note : I suggest you to buy from the lower price to get better points or watch the resistance break in 1 hour chart to get entry confirmation.
Never risk more then 2% of your trade account in single trade.Adjust your stoploss and lot sizez according to money management plan.
Trade Recommendations : Those who want our trade recommendations with proper entry and target points may contact us via email.We have set our minimum fees for the paid clients.
Forex Education : Those who want to learn forex technical analysis can contact us via email.We will start our skype classes session for interested members.
Email : admin@dailygoldanalysis.com
Skype : mati_ji
We always welcome the feedback and comments regarding charts and analysis.
Wish you best of luck for trading
Mati Ur Rehman
Gold Analyst @ dailygoldanalysis.com


