
Daily Gold Analysis 23rd March 2016
Share

Good Morning Gold Lovers
Gold is trading in a range between 1260-40 area.Current market price is 1249-50.I am expecting a big move once gold break its resistance above 1260-65 area.If price fail to break the resistance , we may get better price to buy gold from lows.I am sharing different time frame chart analysis to give my view.Please read the analysis and chart patterns below.
Weekly Chart Analysis
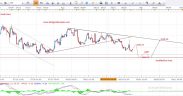
As i mention in my previous analysis, gold recently break its resistance of descending channel and give us bullish thoughts.Now that resistance become support, As long as gold is trading above the support level in weekly chart we will remain bullish and look for buy entry from the better prices.Weekly target for gold is at 1370-90.I have mention support and the target level in the chart below.
Weekly Chart

Daily Chart Analysis
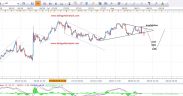
Daily resistance is at 1260-65 area.Today closing of daily candle is below the resistance and forming a inverted hammer at the support level.I am expecting bullish move today from the support.If gold close and break above the resistance 1260-65 area, it will be indication and confirmation to buy gold from the resistance break.Gold next support is at 1224-25 level.If gold move lower and break the immediate support at 1233-37 level, we may see gold at 1224-25 and that will be best area to buy.I have mention support and resistance area in a chart below.
Daily Chart

1 Hour Chart Analysis
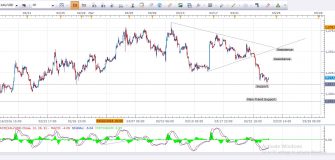
We can predict and catch early move in 1 hour time frame chart.Price is making higher low and lower high in 1 hour chart and forming a symmetric triangle.The beauty of symmetric triangle is , it can break any side.If price break below the support , gold may move to the next support at 1224-25 area.If triangle break from upside , we will have opportunity to buy gold after breaking the resistance level.I suggest you to watch closely and enter the market after confirmation of break.I will update my analysis once i get clear break.I mention support and resistance area in a chart below.
1 Hour Chart

Note : Don’t risk more then 2% of your total account in single trade.Adjust your stop loss and lot size according to proper money management rule.
We always appreciate the comments and feedback regarding the analysis and chart patterns.
Best of luck for trading
Mati Ur Rehman
Gold Analyst @ dailygoldanalysis.com


Gold is trading on 1219. Is it okay to buy. What should be tp and SL.
Wait for the today closing, expecting some more downward movement…1191-93 is the major support. gold may bounce from the phycological major support .
Hi Mr. Matti,
I am following you for sometime and find you quite reliable. Is it possible that I pay you some money and you send me the trade signals. I am just a day trader and i think you can help me with your experience.
Your posts are fantastic but I am not able to enter the trade at the right time.This might also help me to learn from you.
Waiting for your reply.
Regards
Malik Zarar
Hi Malik
Thanks for your positive feedback and concern.
Our live trade section is in process, We are starting trade recommendations for paid members, soon you will have access to that section to buy our trade recommendations for gold .We noted your contact detail we will contact you through email once it is done.
Thanks.