
Daily Gold Analysis 1st June 2016
Share

Good Afternoon Forex Friends
Gold move sideways in yesterday and move little upward during american session.we are expecting more upward movement today. Immediate resistance is around 1221-23 and psychological resistance is forming at 1231-33 level.I am sharing different time frame chart analysis to predict possible next move.Please read the analysis written below.
Weekly Gold Analysis
Gold was bearish in couple of weeks , It was correction mode after the high of 1303-04.Currently metal is trading near to its support zone and we are expecting a bounce from current market level.It is also possible gold may touch its extreme support around 1190-88 before heading up.Overall we are in favor bullish moves for next couple of weeks.We have to look for better price to buy from.Some support levels are 1201-03 and 1191-93 and next resistance is forming at 1231-33 and 1249-51.Movement and closing below 1190-88 will invalidate the overall bullish thoughts in weekly time frame chart.Alternately movement and closing above 1251-55 will take gold towards 1269 and 1281 area.Please see the weekly chart below, i have mention some support and resistance levels with invalidation points.
Weekly Gold Chart

Daily Gold Analysis
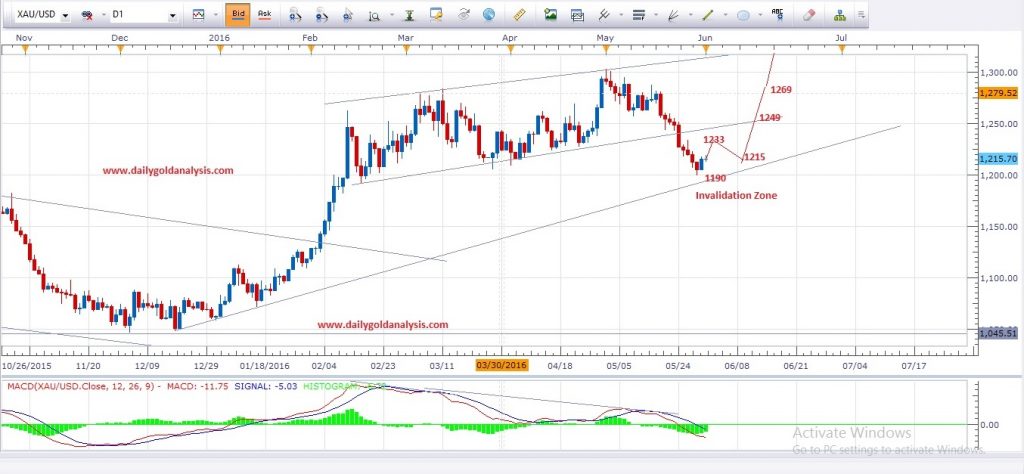
Small bullish candle in yesterday session indicating more bullish move today towards 1231-33 level which is the daily resistance area.Current market price is 1213-14 and major support zone is 1190-88.If gold bounce without touching the support then we will look for daily closing above 1233-35 for further bullish moves.Alternately if gold reverse back and break 1201 level , then we will look for buy entry from 1190-88 towards 1231 minimum.Please see the daily chart below, i have mention possible next move diagram with some price levels and invalidation points.
Daily Gold Chart
4 Hour Gold Chart
4 Hour chart helps us to see the closest picture of trend and to catch early moves.Gold was moving in a small declining channel in hourly chart.It seems gold break the channel range in early morning session that is early indication for bounce.we are expecting a bounce towards 1231 level which is next hourly resistance.Gold may give correction after touching the resistance level.Please see the hourly chart below.I have mention possible next move diagram with some target points.Movement and closing below 1190-88 will invalidate overall bullish thoughts in gold.
4 Hour Gold Chart

Note : Never risk more then 2% of your account capital in single trade.Always trade with proper risk management plan.
Site Announcement And Updates
We are also starting video analysis soon.We are working to make quality videos to give better understanding of our analysis.Our team is working to start education session very soon for beginners to understand the Forex basics.Those who want pro Forex technical analysis course can contact us via email.
Trade Recommendations : Those who want our trade recommendations with proper entry and target points may contact us via email.We have set our minimum fees for the paid clients.
Forex Education : We are starting forex educational technical analysis course from 15th June 2016. Interested members can contact us in our below mention email address.
Email : admin@dailygoldanalysis.com
Skype : mati_ji
Feel free to comment below if you have any concern regarding charts and analysis.Your feedback is always welcome and help us to improve.
Wish you good luck and happy trading
