
Daily Gold Technical Analysis 13th Oct 2016
Share

Good Morning Gold Riders
Due to busy schedule i was not able to post my daily gold technical analysis.I apologize for delay in publishing gold analysis.
In our longer term previous analysis , we were bullish in gold as long gold was respecting its support levels.Gold break its major trend support last week which indicate us to change our thoughts from bullish to bearish.Now the major support become the strong resistance and we are bearish in gold and look for sell entries from every peak levels.We will discuss the major sell areas today.Please go through the different time frame gold technical analysis below.
Weekly Gold Technical Analysis
We were bullish in gold because it was respecting its support level.Gold break its support around 1301 in previous week and move lower towards its brexit support level.Next target for gold may around 1211-15 level.We will look for sell entry from every peak level.Gold is moving in a sideways after touching its support around 1249-48 level.We may see some correction towards 1271 or 1283 in extention.These levels may b the best level to sell gold for next lower target 1211-15.We will look for confirmation in daily or hourly charts to enter in the bearish rally.Please keep in mind movement and closing above the resistance 1301 will invalidate bearish thoughts in longer term.Please have a look in a weekly chart below to get the weekly expecting movement diagram.
Weekly Gold Technical Chart

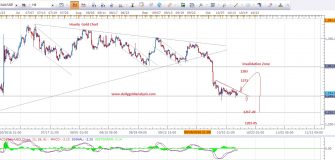
Daily Gold Technical Analysis Chart
After break the support of 1301, Gold move lower towards the brexit support level.This move was unexpected and complete in a single daily candle.Gold is moving in a small range betweek 1249 to 1260 level.We have two different expected thoughts for next movement.We believe gold may give correction towards minimum 1271 and maximum 1283 in extension.We will look for sell entry from the higher price.In case gold fail to give correction, then we will look for possible sell from after the break of support around 1249-48 area.Daily closing below the support will confirm the break.Please have a look in a daily gold technical chart below to get the major selling levels.

4 Hour Gold Technical Analysis
We love to share 4 hour chart because it help us to get the early signal and to spot entry and exit levels.Gold was moving in a small accending trangle pattern in 4 hour time frame chart.Resistance os triangle is around 1257-60 level.Movement above 1261 will confirm the break and give us buying confirmation for short term basis.Minimum target is around 1271 and maximum at 1283.We will look for reversal confirmation from 1283 area.Alternately if gold move down and break the trinangle support around 1249-48.This will lead to to change short term correction thoughts and to jump in bearish move towards 1217 longer tarm target.Please have a look in a hourly chart below to get my technical point of view in gold.

Gold Support and Resistance levels
Daily Support : 1249-48
Daily Resistance 1301
Hourly Support 1249
Hourly Resistance 1261
Note: Never risk more then 2% of your account capital in single trade.Always trade with proper risk management plan.
Please join our Telegram Channel for Trade Updates & Alerts
https://telegram.me/dailygoldanalysis
Feel free to comment below if you have any concern regarding charts and analysis.Your feedback is always welcome and help us to improve.
Wish you good luck and happy trading
Mati Ur Rehman
Gold Analyst @ Dailygoldanalysis.com
Contact Us For Gold Analysis Mentor Services for forex account.
Email : admin@dailygoldanalysis.com
Skype : mati_ji