
Daily Gold Analysis 16th August 2016
Share
Gold Price Today
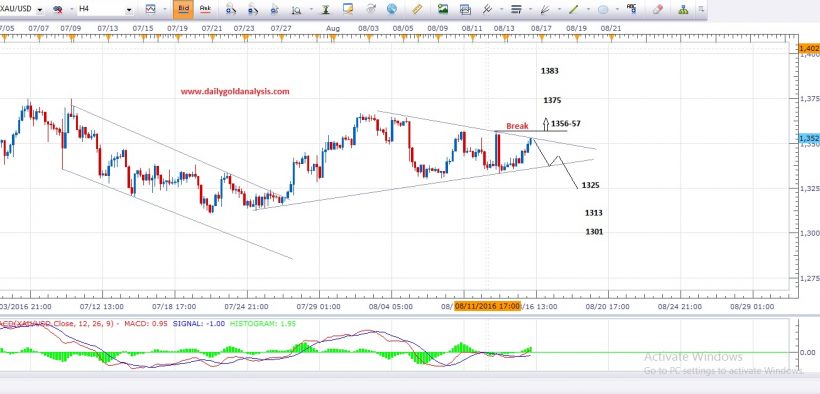
Gold fails to break the support in yesterday session and bounce back.Gold price today is 1351-52 and currently moving in a symmetric triangle.Gold today symmetric resistance is forming at 1352-55 level and symmetric support become 1337-38 level.We will wait for the break confirmation to jump in the next possible bullish rally.If gold break the resistance and close above the resistance in hourly chart, We will jump for the bullish trade with minimum target 1375 and maximum 1383-85 level.Alternate scenerio if gold price today fail to break the resistance and reverse back , in that case we may see gold at the support level 1337-38, and break of support will take gold towards 1325 and 1311 level.I am sharing 4 hour gold chart below, which shows how to trade gold today.Please have a look in a chart below.
4 Hour Gold Technical Chart

Note: Never risk more then 2% of your account capital in single trade.Always trade with proper risk management plan.
Please join our Telegram Channel for Trade Updates & Alerts
https://telegram.me/dailygoldanalysis
Feel free to comment below if you have any concern regarding charts and analysis.Your feedback is always welcome and help us to improve.
Wish you good luck and happy trading
Mati Ur Rehman
Gold Analyst @ Dailygoldanalysis.com
Email : admin@dailygoldanalysis.com
Skype : mati_ji


